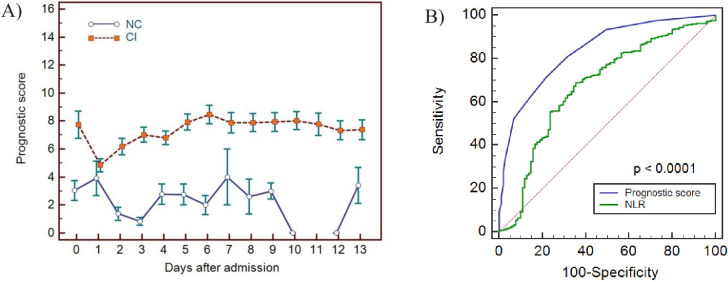
Figure 11. Haemocytometric COVID-19 prognostic score prediction of clinical severity in the validation cohort.
(A) Validation cohort prognostic score 14-day hospitalisation time horizon comparing non-critical (NC) and critical illness (CI) groups, (B) ROC curve comparisons of prognostic score and NLR over 14 days. The prognostic score AUC (0.838, 95%CI 0.809-0.864) was significantly higher (P<0.0001) than the NLR AUC (0.673,95% CI 0.637-0.707). The number of measurements for each day of hospitalisation that were available per patient group are shown in Figure 11—source data 1. Overall, there were relatively few measurements per day for the NC group which has contributed to greater variance per time point.

