. 2020 Nov 26;9:e63195. doi: 10.7554/eLife.63195

Figure 6. Trends of red blood cell-related parameters over 14 days of hospitalisation in critical illness (C) and non-critical (NC) patients.

Figure 6.

Note: 14 days of hospitalisation refers to day 0 (day of admission) plus the first 13 days after admission. The normal reference range is depicted by the area between the dotted horizontal lines. Vertical bars indicate standard error of the mean (SEM). (A) Haemoglobin (HGB) corrected for age and gender, (B) reticulocyte count (RET), (C) difference in haemoglobinisation of reticulocytes and red blood cells (DELTA-He), (D) nucleated red blood cells (NRBC). The number of sample measurements available per day for the trend analysis for the parameters plotted per patient group are shown in Figure 6—source data 1.

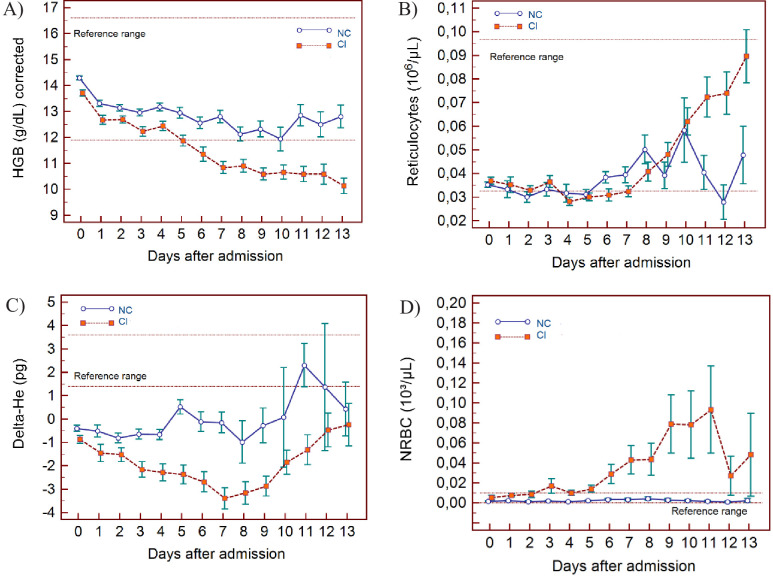
Figure 6—source data 1. Source data for number of measurements for each day of hospitalisation that were available per patient group for the trends of red blood cell-related parameters over 14 days of hospitalisation.
Figure 6—source data 2. Source data for trends of corrected haemoglobin values over 14 days of hospitalisation in critical illness (CI) and non-critical (NC) patients.
Figure 6—source data 3. Source data for trends of absolute reticulocyte count over 14 days of hospitalisation in critical illness (CI) and non-critical (NC) patients.
Figure 6—source data 4. Source data for trends of Delta-He values over 14 days of hospitalisation in critical illness (CI) and non-critical (NC) patients.
Figure 6—source data 5. Source data for trends of nucleated red blood cell counts over 14 days of hospitalisation in critical illness (CI) and non-critical (NC) patients.