
Figure 9. Sex-separated Bax-/- mice fail to generate sexually dimorphic representations of Olfr910, Olfr912, and Olfr1295.
(A) Volcano plot comparing expression of Olfrs between 26-week-old Bax-/- sex separated male and female mice. Olfr910, Olfr912, and Olfr1295 are highlighted in red. The red dashed line indicates an FDR = 0.05. Data are from n = 3 male and n = 3 female mice. (B) Left: representative in situ mRNA hybridization pictures probing for the expression of Olfr910 in Bax-/- 43-week-old sex-separated male (top) and female (bottom) mice. Scale bars indicate 50 μm. Right: summary data showing mean and SEM of the density of OSNs expressing Olfr910 in Bax-/- 43 week-old sex-separated male and female mice. An unpaired two-tailed t-test reveals no statistical difference (ns; p > 0.05) between males and females. Data are from n = 3 male and n = 3 female mice. (C) Left: representative in situ mRNA hybridization pictures probing for the expression of Olfr912 in Bax-/- 43-week-old sex-separated male (top) and female (bottom) mice. Right: summary data showing mean and SEM of the density of OSNs expressing Olfr912 in Bax-/- 43-week-old male and female mice. An unpaired two-tailed t-test reveals no statistical difference between males and females (ns; p > 0.05). (D) Left: representative in situ mRNA hybridization pictures probing for the expression of Olfr1295 in Bax-/- 43-week-old sex-separated male (top) and female (bottom) mice. Right: summary data showing mean and SEM of the density of OSNs expressing Olfr1295 in Bax-/- 43-week-old male and female mice. An unpaired two-tailed t-test reveals no statistical difference between males and females (ns; p > 0.05).

Figure 9—figure supplement 1. Sex-separated Bax-/- mice fail to generate sexually dimorphic representations of Olfr1437 and Olfr235. .
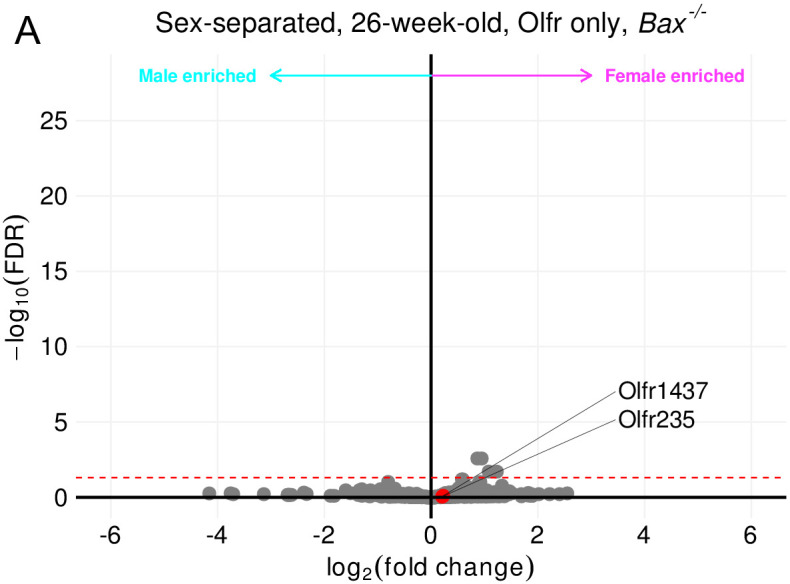
Figure 9—figure supplement 2. Bax-/- mice exhibit significant changes in their OR repertoire.
