
Figure 1.
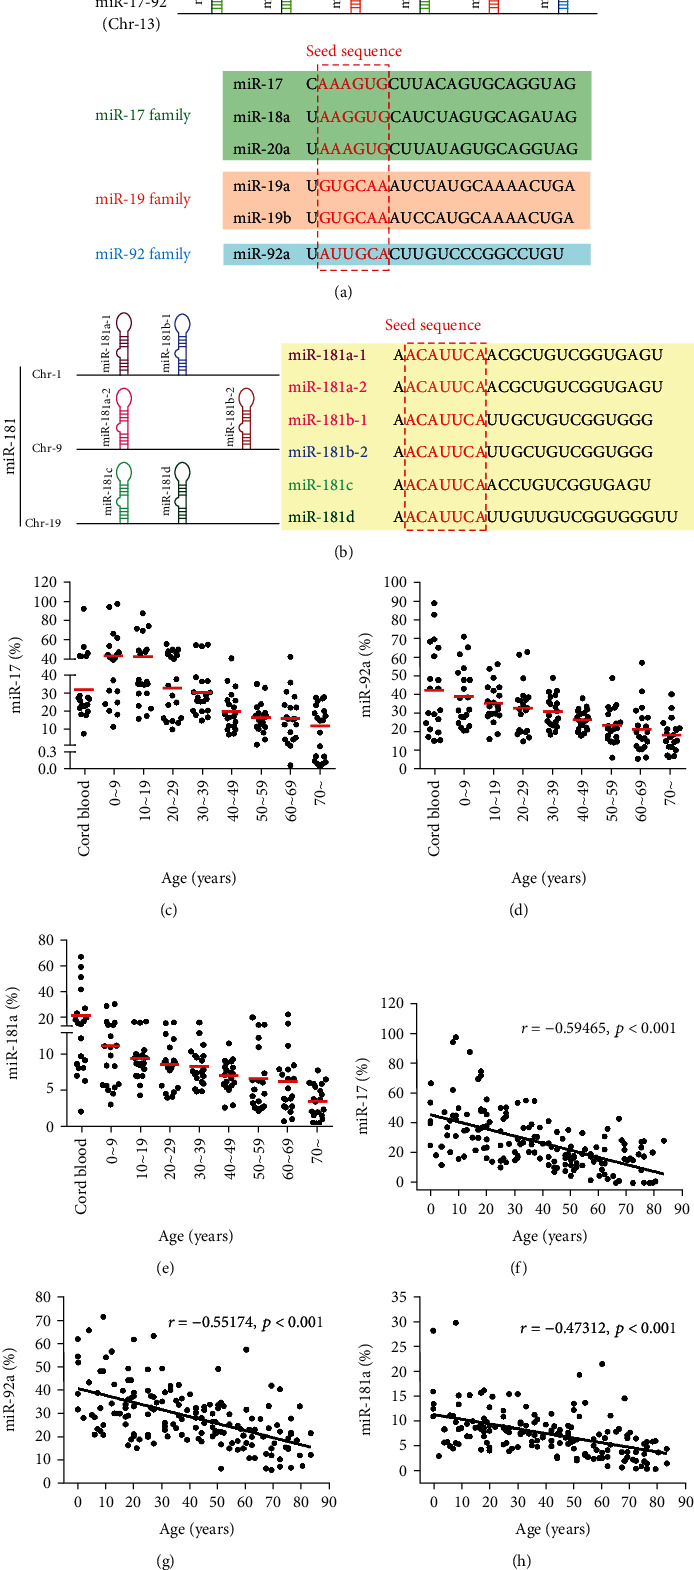
The expression levels of miR-17, miR-92a, and miR-181a in PBMCs are downregulated with age. (a) The location and members of the miR-17-92 cluster and the sequences of the six members in three families. Green: members of the miR-17 family; red: members of the miR-19 family; blue: members of the miR-92 family. (b) miR-181 family members and their genomic locations. (c–e) Quantification of the data revealed that the expression levels of miR-17 (c), miR-92a (d), and miR-181a (e) were downregulated with age (n = 20/each age group). (f–h) A negative correlation between age and miR-17 (f), miR-92a (g), and miR-181a (h) is shown.