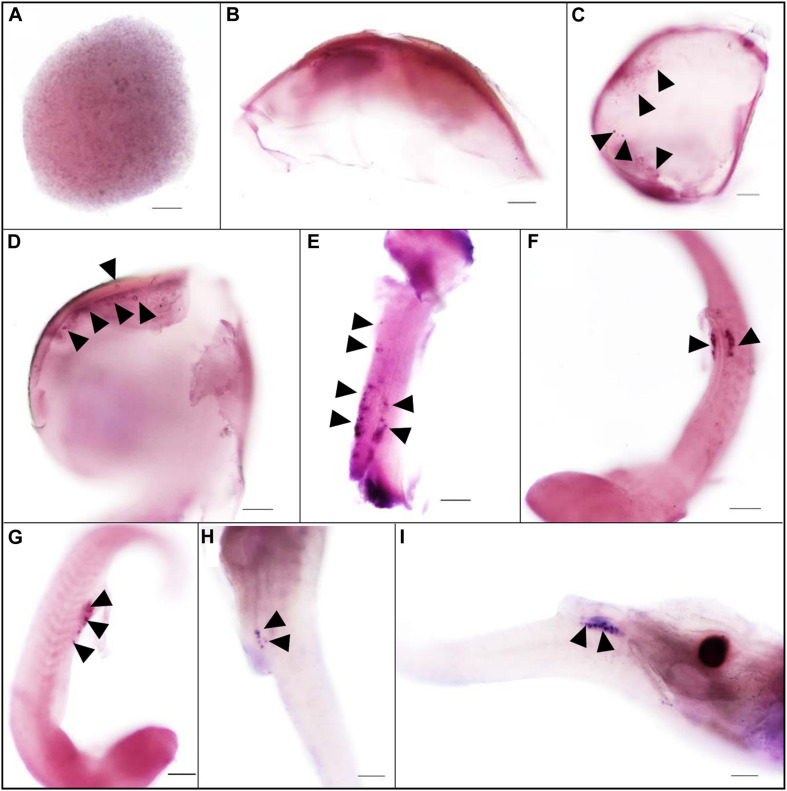
FIGURE 2.
The expression pattern of Ssvas during embryogenesis was analyzed with WISH. All blastomeres were strongly stained at the blastula stage (A). The signal in the cell became non-uniform at the 30%-epiboly stage (B). Ssvas-positive cells appeared at the 70% epiboly stage (C). PGCs randomly aligned along the anterior of the body axes at the 90% epiboly stage–early neurula stage (D) and lined along the anterior–posterior axis on both sides of the embryonic body at the somite stage (E). PGCs formed two clusters and aligned bilaterally on the ventral side at heart beating stage (F,G) and localized at the dorsal sides of the gut, ventral side of notochord at hatching Sage (H,I). Black arrowheads indicated Ssvas-positive cells (PGCs) (stained with dark purple or blue). Scale bar, 100 μm.

