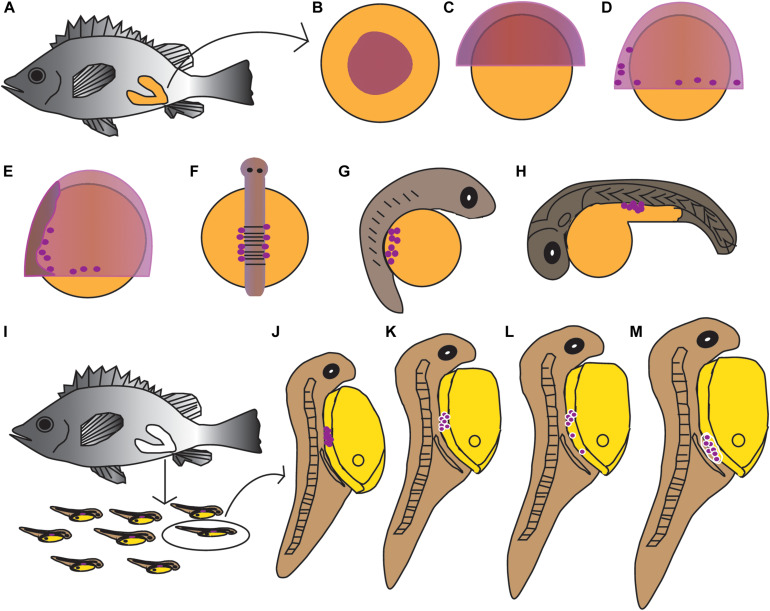
FIGURE 4.
Schematic illustration of the germline formation process in Sebastes schlegelii. Dark purple spots indicated PGCs signals. (A–H) The migration of PGCs from embryos in female fish after fertilization. (A) The overall appearance of the female after fertilization; (B) blastula stage; (C) 30% epiboly stage; (D) 70% epiboly stage; (E) 90% epiboly stage–early neurula stage; (F) somite stage; (G) heart beating stage; (H) hatching stage. (I–M) The migration of PGCs from larvae after birth. (I) The larvae were born from mature females; (J) 2 dab; (K) 8 dab; (L) 9 dab; and (M) 10–15 dab.

