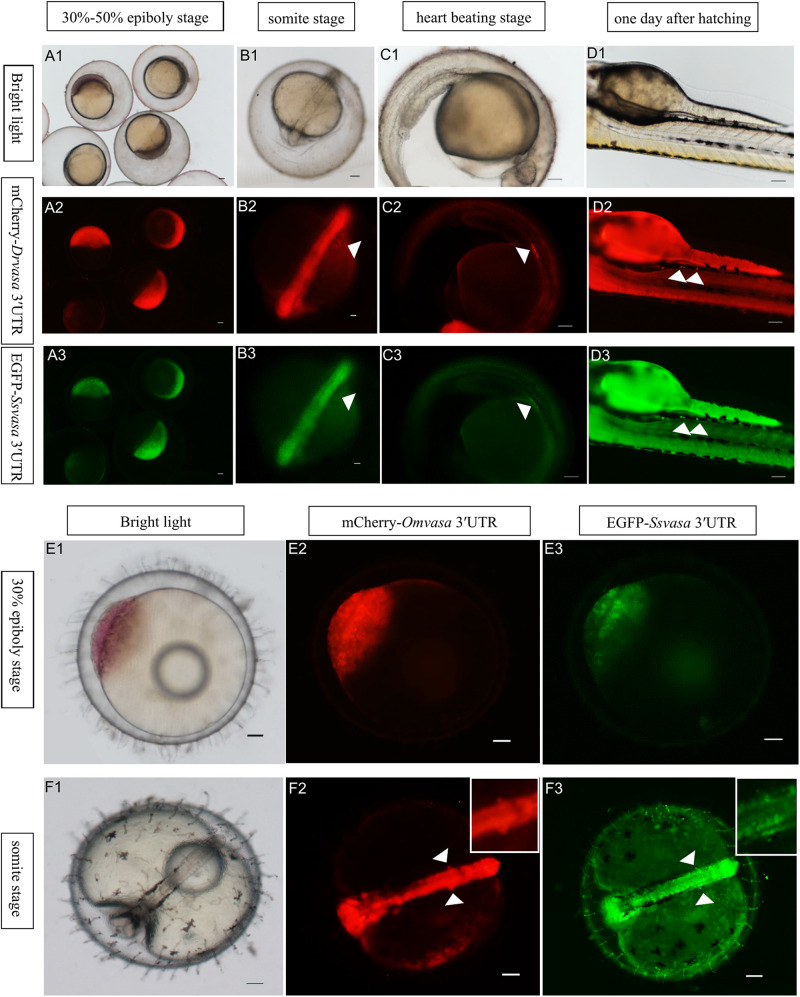
FIGURE 6.
Visualization of the PGCs of zebrafish and marine medaka by Sebastes schlegelii vasa 3′UTR. (A1–D3) Visualization of zebrafish PGCs by co-microinjection EGFP-Ssvas 3′UTR and mCherry-Drvasa 3′UTR mRNAs. Fluorescence first expressed in the blastoderm at the 30–50% epiboly stage (A1–A3); PGCs differentiated from somatic cells and gathered on both sides of the embryonic body at the somite stage (B1–B3); PGCs aggregated under the trunk at the heart beating stage (C1–C3) and settled on the dorsal part of the gut at 1 day after hatching (D1–D3). (E1–F3) Visualization marine medaka PGCs by co-microinjection of EGFP-Ssvas 3′UTR and mCherry-Omvasa 3′UTR mRNAs. Fluorescence appeared at the 30% epiboly stage (E1–E3) and PGCs aligned on both sides of the trunk at the somite stage (F1–F3). The insets in F2 and F3 were magnification of signal areas. PGCs were indicated by white arrows. Scale bars, 100 μm.

