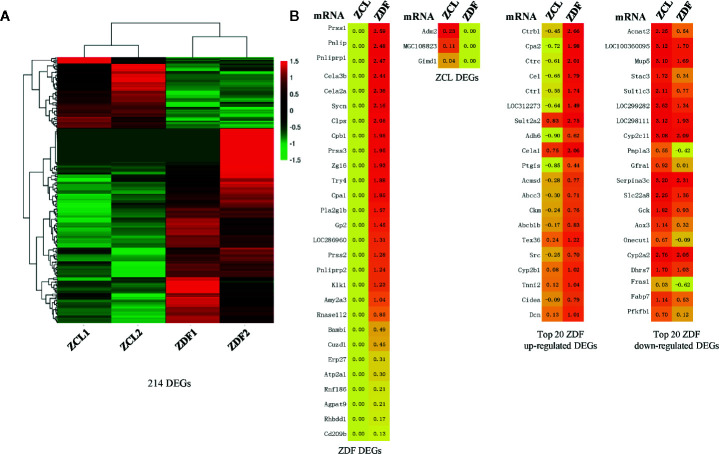
Figure 3.
Profiles of differentially expressed mRNAs between Zucker control lean (ZCL) and Zucker diabetic fatty (ZDF) rats. (A) Heatmap showing the DEGs between ZCL and ZDF rats (p < 0.05, |fold-change| ≥ 2, FPKM ≥ 1). The color key indicates the relative expression level (log10 (FPKM)) between ZCL and ZDF rats, ranging from green (low expression) to red (high expression). (B) Heatmaps showing the representative DEGs between ZCL and ZDF rats. Specifically expressed DEGs and top 20 up- and down-regulated DEGs are separately exhibited (B). The colors indicate the expression level (log10 (FPKM)), ranging from yellow (low expression) to red (high expression). The value of are shown in the cells.

