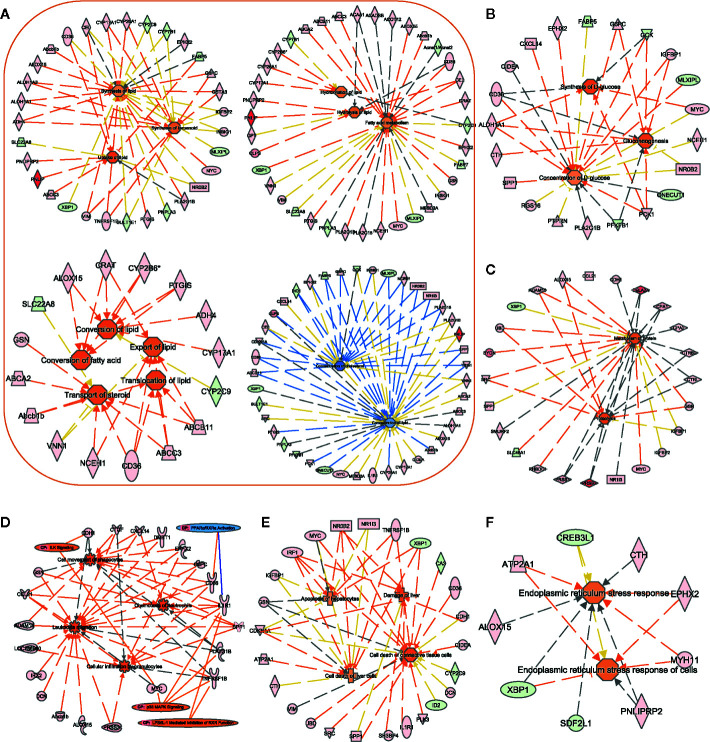
Figure 6.
Assessment of the biofunction activity in Zucker diabetic fatty (ZDF) rats. Using the IPA software, we performed functional enrichment analyses of DEGs and evaluated the activation Z-score of the biofunction items, such as “lipid metabolism”- (A), “carbohydrate metabolism”- (B), “protein metabolism”- (C), “immune cell trafficking”- (D), “liver injury”- (E), and “ER stress”- (F) related functions. Center icons in networks, significantly activated/inhibited biofunctions; peripheral icons, DEGs between ZCL and ZDF rats and significantly activated/inhibited canonical pathways. Colors of DEGs indicate the estimate of expression levels, (log10 (FPKM)) ranging from green (low expression) to red (high expression). Colors of biofunctions and canonical pathways indicate the activation Z-score, ranging from blue (inhibited) to orange (activated). Orange lines indicate that DEGs support the activation of biofunctions/canonical pathways. Blue lines indicate that DEGs support the inhibition of biofunctions/canonical pathways. Gray lines indicate that DEGs are involved in biofunctions/canonical pathways, but do not affect their activity. DEGs, differentially expressed genes; CP, canonical pathways.

