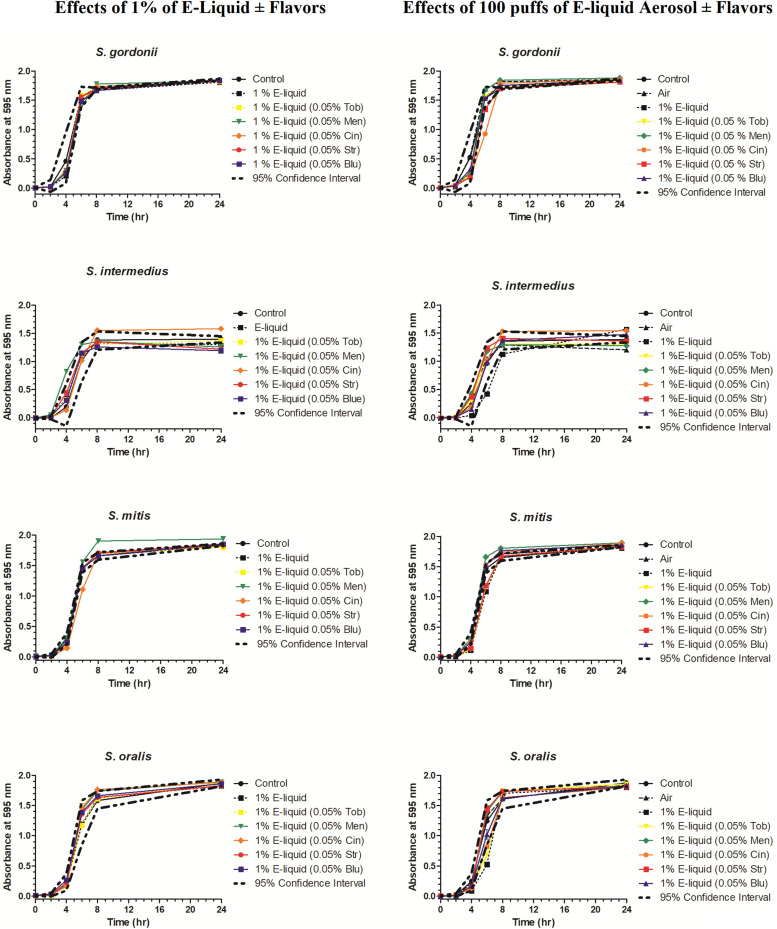
FIGURE 3.
Effects of 100 μL E-liquid ± flavorings (1% in BHI) added directly into BHI (graphs on left) and 100 puffs of ECIG-generated aerosol ± flavorings (approximately 1%) pumped into BHI (graphs on right) on streptococcal 24-h growth curves. Each point represents Mean ± SEM, n = 12 is the number of replicates.

