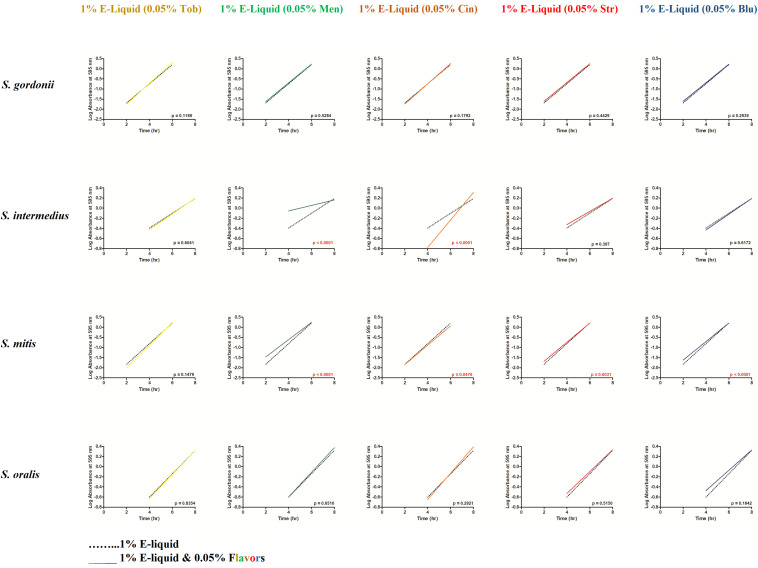
FIGURE 4.
From the Figure 3 data, linear regressions were determined depicting the effects of 100 μL of E-liquid ± flavorings on bacterial growth during the log phase of the 24-h growth curves (i.e., between 2 and 6 h for S. gordonii and S. mitis and between 4 and 8 h for S. intermedius and S. oralis). One hundred microliters of E-liquid in 10 mL of BHI = 1%. The flavoring present in the E-liquid = 0.05%. Within each graph panel (i.e., bacteria/flavoring combination), red p-values (p < 0.05) indicate the slopes of the regression lines are significantly different. Each slope is calculated from 36 data points (3 time points X 12 replicates for each time point).

