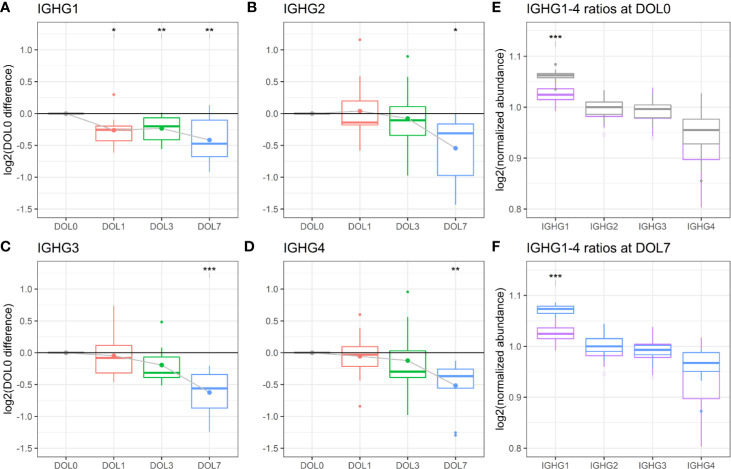
Figure 10.
Protein levels of (A–D) IgG1-4 across the first week of life as compared to DOL0, with mean abundance difference indicated by dots connected by solid line. (E) Comparison of the ratios of IgG1-4 normalized to IgG2 between adult-levels (purple) and newborn-levels at DOL0 (gray), or (F) DOL7 (blue). Statistics A–D (E, F): q-value <0.05: *, <0.01: **, <0.001: ***.

