Figure 2.

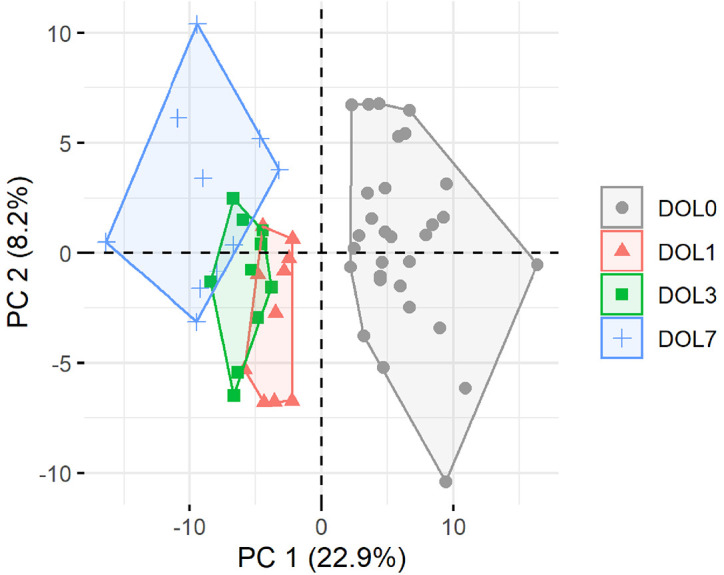
Principal component analysis (PCA) plot of all quantifiable proteins separates samples by day of life (DOL). PC, principal component. Explained variance given in percentages.

Principal component analysis (PCA) plot of all quantifiable proteins separates samples by day of life (DOL). PC, principal component. Explained variance given in percentages.