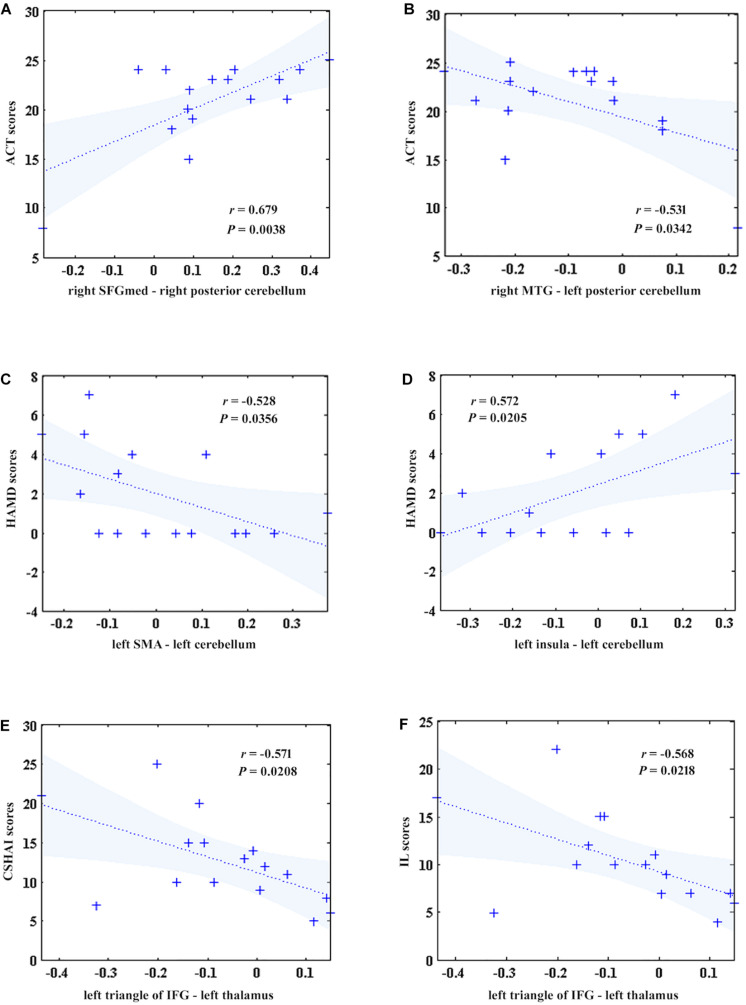
FIGURE 4.
The correlations between five discriminant features and clinical symptoms in patients after treatment. (A) The FC between the right SFGmed and right superior cerebellum was positively correlated with ACT scores (r = 0.679, P = 0.0038). (B) The FC between the right MTG and left superior cerebellum was negatively correlated with ACT scores (r = –0.531, P = 0.0342). (C) The FC between the left SMA and left superior cerebellum was negatively correlated with HAMD scores (r = –0.528, P = 0.0356). (D) The FC between the left insula and left superior cerebellum was positively correlated with HAMD scores (r = 0.572, P = 0.0205). (E) The FC between the left IFGmed and left thalamus was negatively correlated with CSHAI scores (r = –0.571, P = 0.0208). (F). The FC between the left IFGmed and left thalamus was negatively correlated with IL scores (r = –0.568, P = 0.0218). ACT, asthma control test; SFGmed, medial superior frontal gyrus; MTG, middle temporal gyrus; IFG, inferior frontal gyrus; HAMD, Hamilton depression rating scale; SMA, supplementary motor area; CSHAI, Chinese version of Short Health Anxiety Inventory; IL, illness likelihood (a factor of CSHAI).

