FIGURE 9.
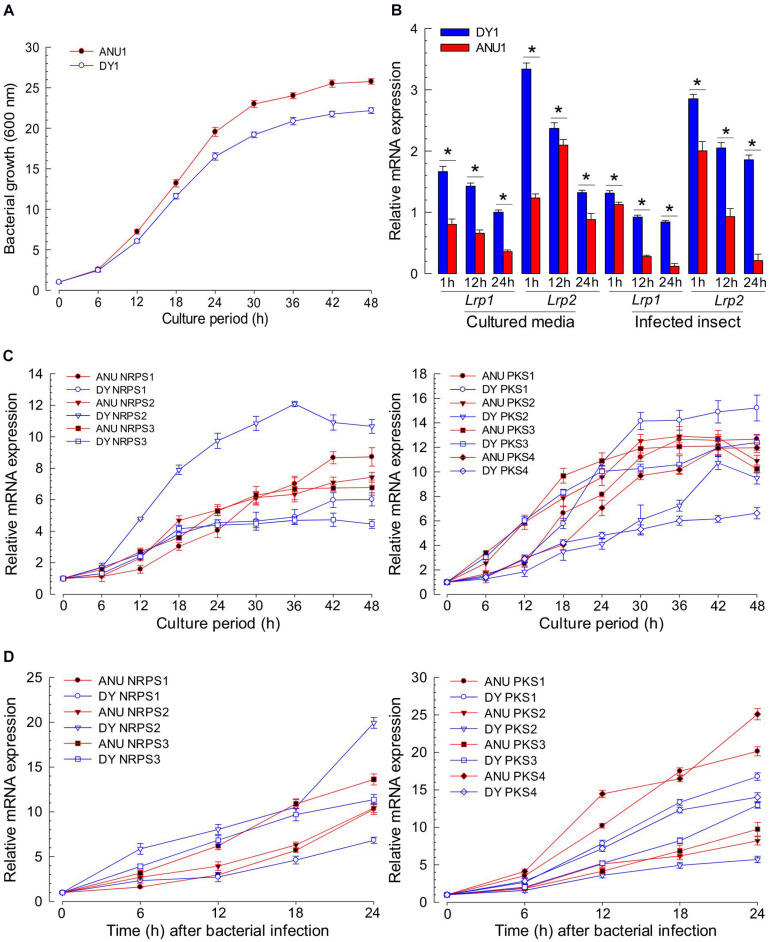
Comparative analysis of NRPS-PKS gene expression between two strains of X. hominickii. (A) Their growth curves at 28°C in TSB broth. (B) Temporal expression levels of two Lrp genes during bacterial growth. Asterisks above standard error bars indicate significant differences between means of two strains at each time pint at Type I error = 0.05 (LSD test). (C) Comparative expression analysis of three NRPS (left panel) and four PKS (right panel) genes between the two strains during bacterial growth in TSB broth. (D) Comparative expression analysis of three NRPS (left panel) and four PKS (right panel) genes between two strains during bacterial growth in S. exigua. Each L5 larva was infected with 102 cfu of X. hominickii. Each treatment was independently replicated three times.

