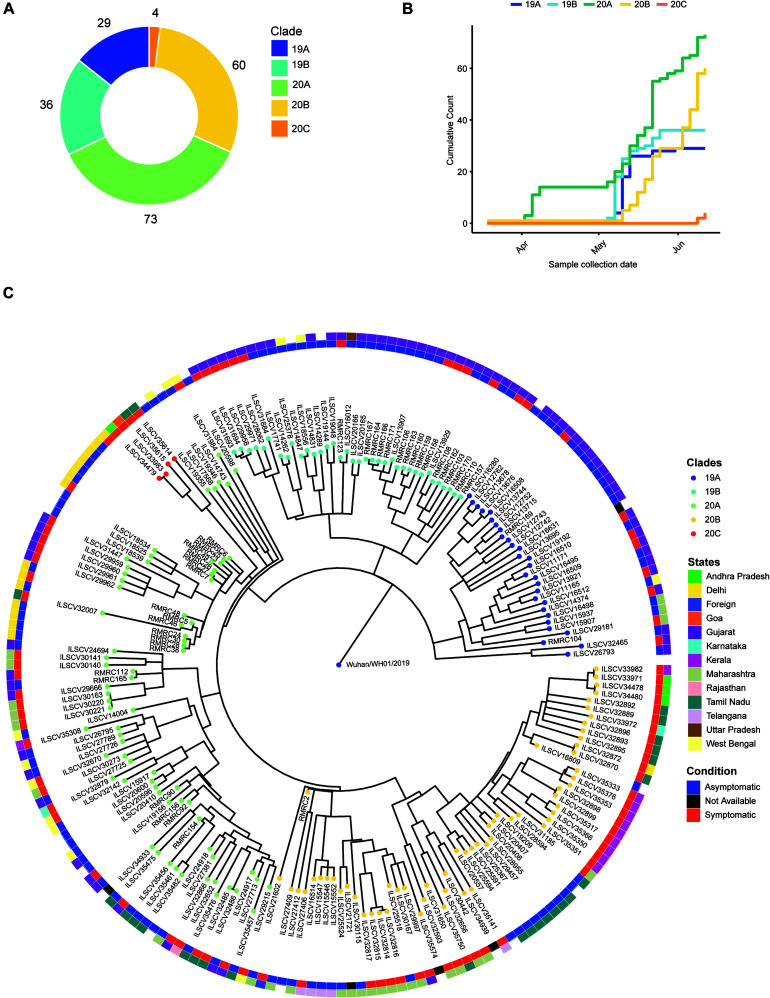
FIGURE 1.
Phylogenetic analysis of the SARS-Cov genomes and their distribution into different Nextstrain defined new clades. (A) A donut chart representing the sequenced sample (n = 202) distribution across the clades (clade nomenclature obtained using Nextstrain). (B) Cumulative count of clades plotted against sample collection date showing abundance of clades with time. (C) Time tree (1,000 bootstraps) of the sequenced samples (n = 202) generated using Nextstrain time-tree pipeline overlaid with clinical status (condition, inner circle) of the patients during sample collection, place of migration (state, outer circle), and clade information (clades).

