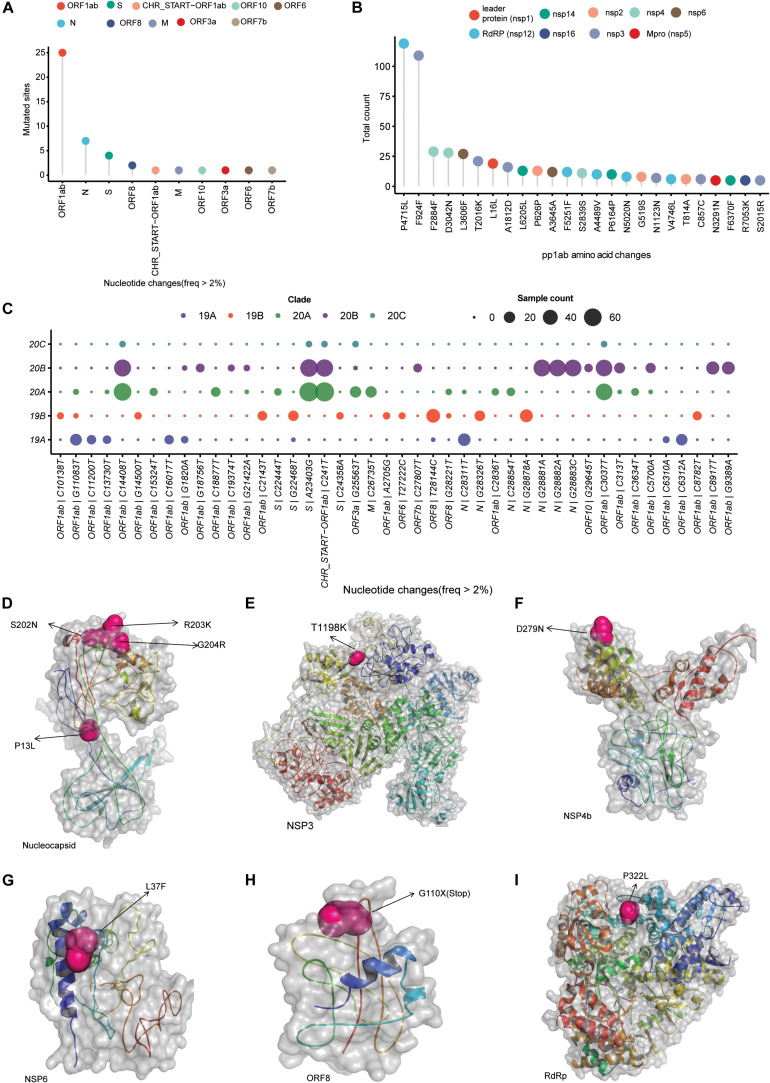
FIGURE 2.
SARS-CoV-2 clade distribution and their prevalent mutation profiles. (A) Dot plot representing the number of single-nucleotide mutation (occurred in more than 2% of the samples) present in different genomic segments of SARS-CoV-2 genome. (B) The ORF1ab region codes for a polypeptide are later cleaved to several mature peptides. The dot plot represents the amino acid changes (location of amino acid acids as per location in polypeptide sequence) in the mature peptides of ORF1ab. (C) Clade-wise occurrence of nucleotide mutations with presence in more than 2% of sequenced samples (n = 202). Color of the dots represents the clade and size of the dots represents number of the samples showing presence of the single-nucleotide variant. (D–I) The mutation sites on the modeled structures of the SARS-CoV-2 proteins. The mutation site(s) of the NSP3, NSP4b, NSP6, RdRP, and nucleocapsid proteins are marked as sphere, while the rest of the structure is shown in cartoon representation.

