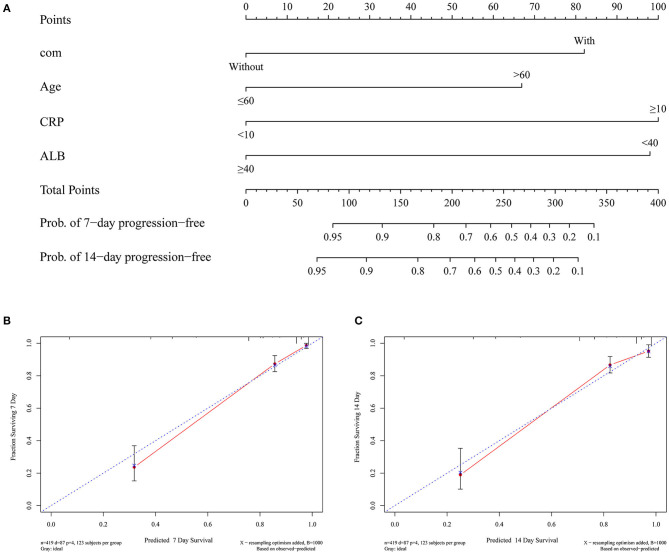
Figure 4.
Development and validation of a predictive nomogram for the probability of severe COVID-19. (A) A predictive nomogram was developed based on the independent risk factors associated with the severity of COVID-19. (B) The 7-day predictive performance of the nomogram with a slope of 0.95 (R2 = 0.89). (C) The 7-day predictive performance of the nomogram with a slope of 0.96 (R2 = 0.92).

