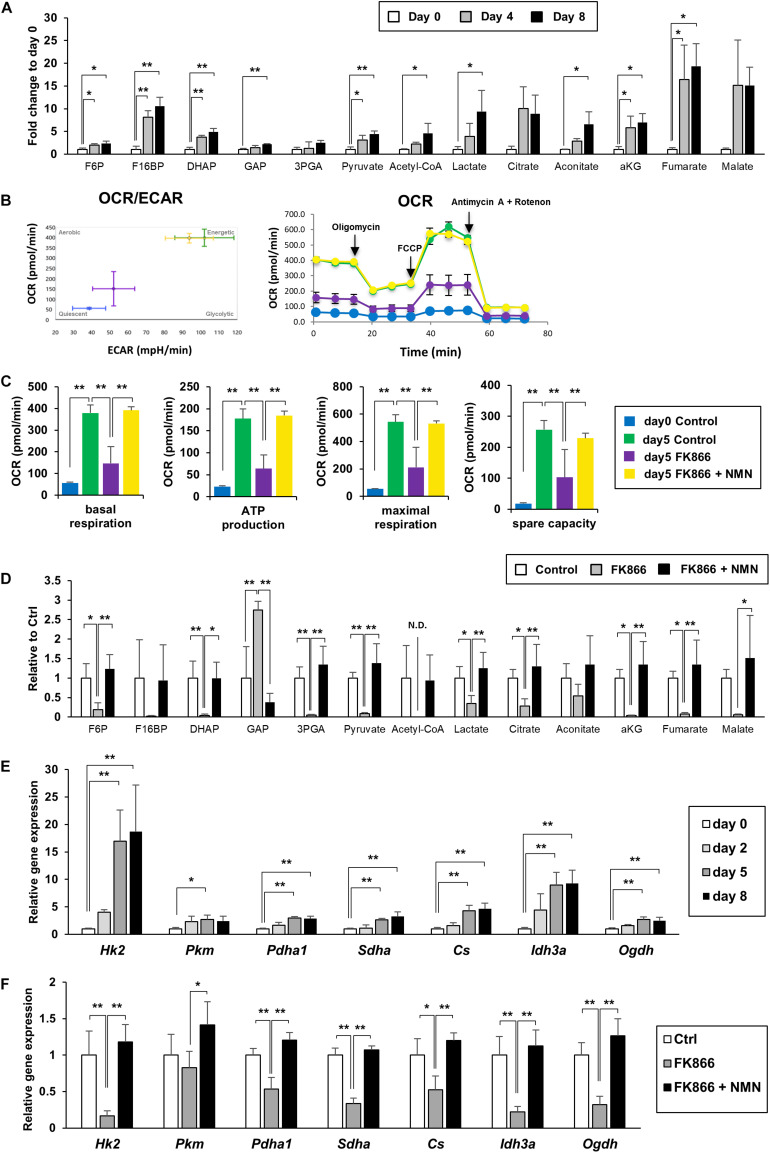
FIGURE 2.
Upregulation of NAD+ synthesis promotes energy metabolism during 3T3-L1 preadipocyte differentiation. (A) Metabolites of glycolysis and the TCA cycle in 3T3-L1 cells were measured with LC-MS or GC-MS during the differentiation (n = 3). Data are represented as mean ± SD. Each abbreviation represents as follows, F6P: Fructose 6-phosphate, F16BP: Fructose 1,6-bisphosphate, DHAP: Dihydroxyacetone phosphate, GAP: Glyceraldehyde 3-phosphate, 3PGA: 3-phosphoglycerate, aKG: alpha-ketoglutarate. (B,C) Oxygen comsumption rate (OCR) and extracellular acidification rate (ECAR) were measured with flux analyzer on day 5 during the differentiation of 3T3-L1 cells treated with 100 nM FK866 or 100 nM FK866 and 100 μM NMN (B). Basal respiration, ATP production, maximal respiration, and spare capacity were calcurated from the difference of OCR, injecting Oligomycin, FCCP, and Antimycin A + Rotenon (C). (n = 6) Data are represented as mean ± SD. (D) Metabolites of glycolysis and the TCA cycle on day 4 during the differentiation of 3T3-L1 cells treated with 100 nM FK866 (n = 4) or 100 nM FK866 and 100 μM NMN. Data are represented as mean ± SD. (E) Relative expression levels of enzymes in glycolysis and the TCA cycle during the differentiation of 3T3-L1 cells. (n = 4) Data are represented as mean ± SD. (F) Relative expression levels of enzymes in glycolysis and the TCA cycle on day 5 of the differentiation of 3T3-L1 cells treated with 100 nM FK866 or 100 nM FK866 and 100 μM NMN (n = 4). Data are represented as mean ± SD. *p < 0.05, **p < 0.01.

