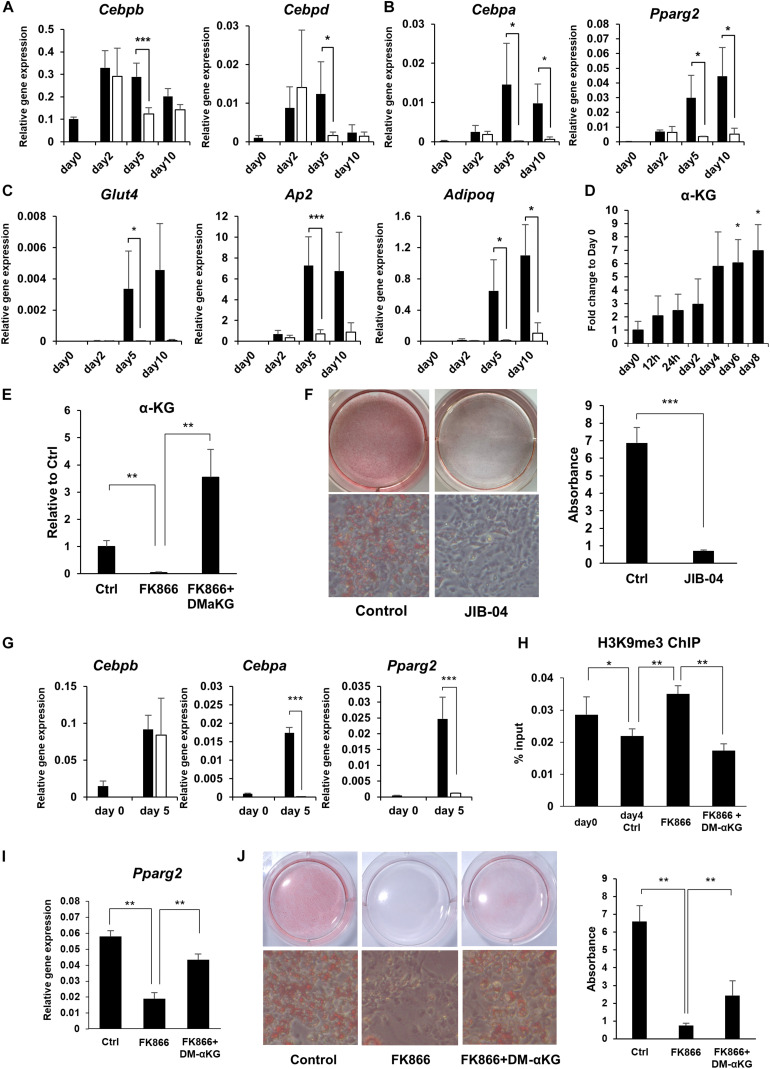
FIGURE 3.
NAD+ biosynthesis in the salvage pathway regulates adipogenic gene expression. (A–C) Relative expression levels of genes related to adipogenesis during the differentiation of 3T3-L1 cells treated with 100 nM FK866 (n = 3). Data are represented as mean ± SD. The black bars represent control and the white bars represent FK866. (D) α-KG levels during the differentiation of 3T3-L1 cells measured with GC-MS (n = 3). Data are represented as mean ± SD. (E) α-KG levels on day 5 of differentiation of 3T3-L1 cells treated with 100 nM FK866 or 100 nM FK866 and 5 mM dimethyl alpha-ketoglutarate (DM-αKG) (n = 4). Data are represented as mean ± SD. (F) 3T3-L1 cells treated with JIB-04 were stained with Oil Red-O on day 8 of differentiation. The lipid accumulation was quantified as absorbance. (n = 5) Data are represented as mean ± SD. (G) Relative gene expression levels of 3T3-L1 cells treated with JIB-04 during differentiation (n = 4). Data are represented as mean ± SD. The black bars represent control and the white bars represent JIB-04. (H) H3K9me3 in the promoter region of Pparg was measured with ChIP-qPCR on day 4 during the differentiation of 3T3-L1 cells treated with 100 nM FK866 or 100 nM FK866 and 5 mM DM-αKG (n = 5). Data are represented as mean ± SD. (I) Relative gene expression levels of 3T3-L1 cells treated with 100 nM FK866 or 100 nM FK866, and 5 mM DM-αKG on day 4 of differentiation (n = 5). Data are represented as mean ± SD. (J) Oil Red-O staining of 3T3-L1 cells treated with 100 nM FK866 or with 100 nM FK866 and 5 mM DM-αKG on day 8 of differentiation. The lipid accumulation was quantified as absorbance. (n = 4). Ctrl represents control. *p < 0.05, **p < 0.01, ***p < 0.005.

