FIGURE 4.
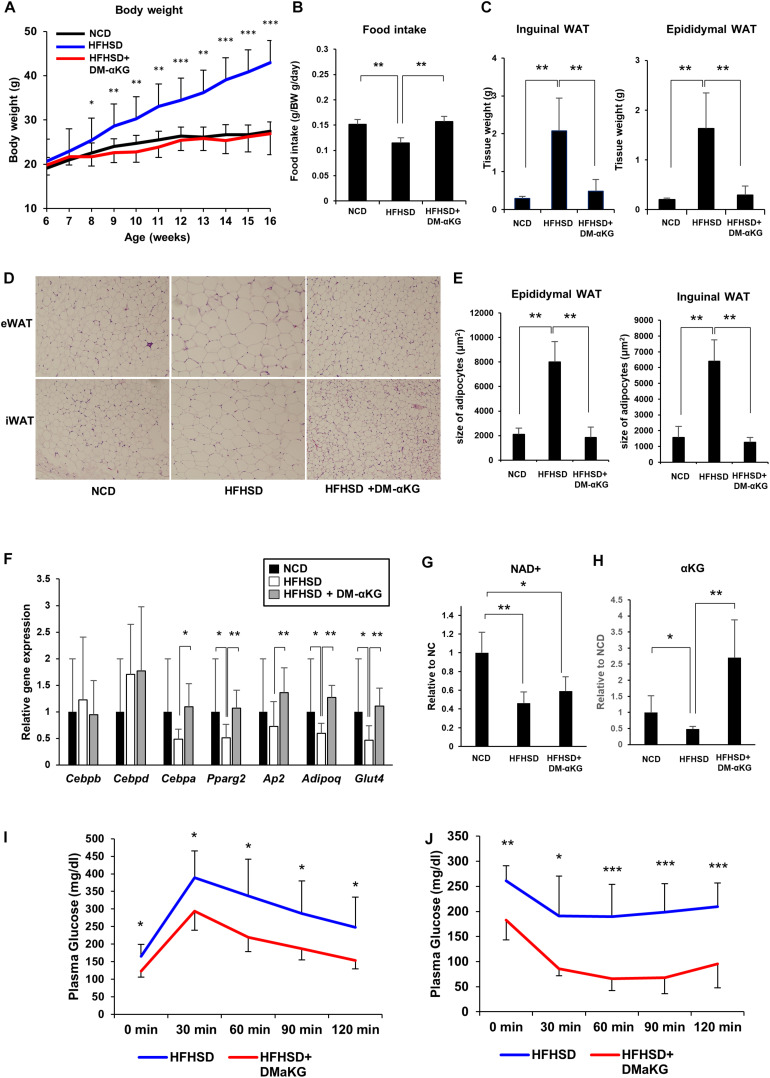
DM-αKG supplementation prevents diet-induced obesity in mice by promoting appropriate adipogenesis. (A) Body weight of C57BL/6J mice fed a normal chow diet (NCD) or high fat high sucrose diet (HFHSD) (n = 4–6). 1.5% dimethyl α-ketoglutarate (DM-αKG) was supplemented in the drinking water. Data are represented as mean ± SD. (B) The average of food intake of each group was measured weekly for the first 4 weeks and was adjusted by body weight. Data are represented as mean ± SD. (n = 4). (C) The weight of white adipose tissue was measured at 16 weeks of age. Data are represented as mean ± SD. (n = 4–6). (D) Representative images of paraffin sections of white adipose tissue at 16 weeks old stained with hematoxylin and eosin (H&E). Images were acquired with an Olympus BX61, 10×. (n = 2). (E) Adipocyte size in H&E stained samples was calculated using ImageJ. (n = 8) Data are represented as mean ± SD. (F) Relative expression levels of genes related to adipogenesis in epididymal white adipose tissue (eWAT) at 16 weeks old (n = 6). Data are represented as mean ± SD. (G) The level of NAD+ in eWAT of wild type mice fed NCD, HFHSD, or HFHSD with DM-αKG were measured after 10 weeks of HFHSD with LC-MS. Data are represented as mean ± SD. (n = 4). (H) The level of α-KG in blood plasma of wild type mice fed NCD, HFHSD, or HFHSD with DM-αKG were measured after 10 weeks of HFHSD with GC-MS. Data are represented as mean ± SD. (n = 4). (I), (J) The plasma glucose level in intraperitoneal glucose tolerance test after 10 weeks of HFHSD (I) and in intraperitoneal insulin tolerance test after 16 weeks of HFHSD (J). Data are represented as mean ± SD (n = 5–6). *p < 0.05, **p < 0.01, ***p < 0.005.

