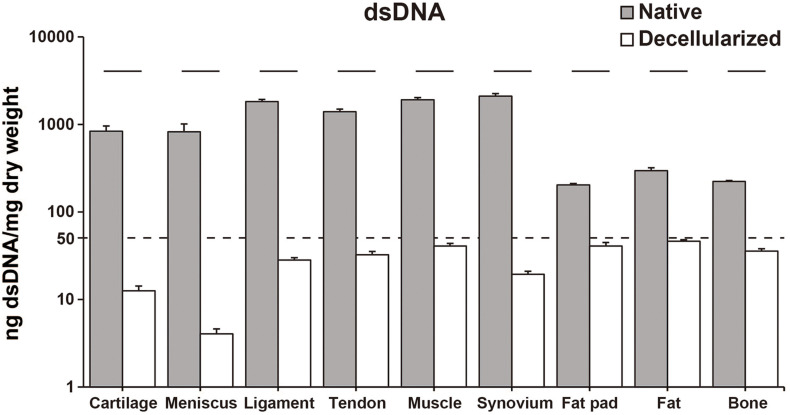
FIGURE 2.
dsDNA content of native and decellularized tissue. Y-axis was indicated with logarithmic scale; dotted line at 50 ng/mg is established threshold for sufficient decellularization. n = 5 per condition. Lines over bars indicate significant difference between native and decellularized tissue of each region, p < 0.001. dsDNA, double stranded DNA.

