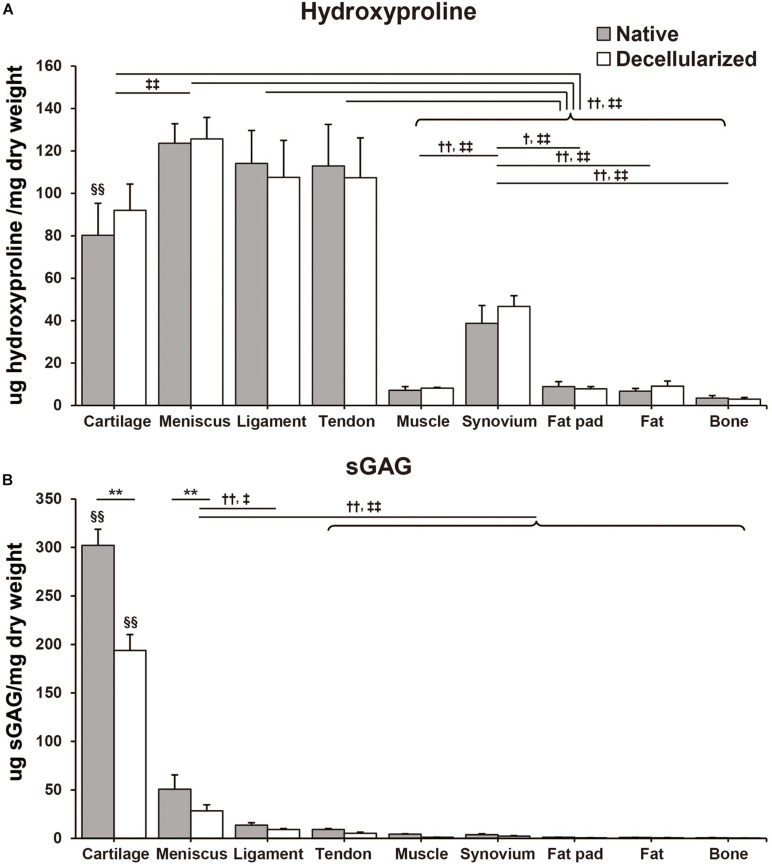
FIGURE 3.
Biochemical composition of native and decellularized tissue. (A) Total hydroxyproline and (B) total sulfated glycosaminoglycan (sGAG) content in native and decellularized tissue. n = 5 per condition. **p < 0.01, significant difference between native and decellularized tissue for each step. †p < 0.05, ††p < 0.01, significant difference between regions in a given native tissue. ‡p < 0.05, ‡‡p < 0.01, significant difference between regions in a given decellularized tissue. §§ p < 0.01, significant difference from any other tissues in the same step.

