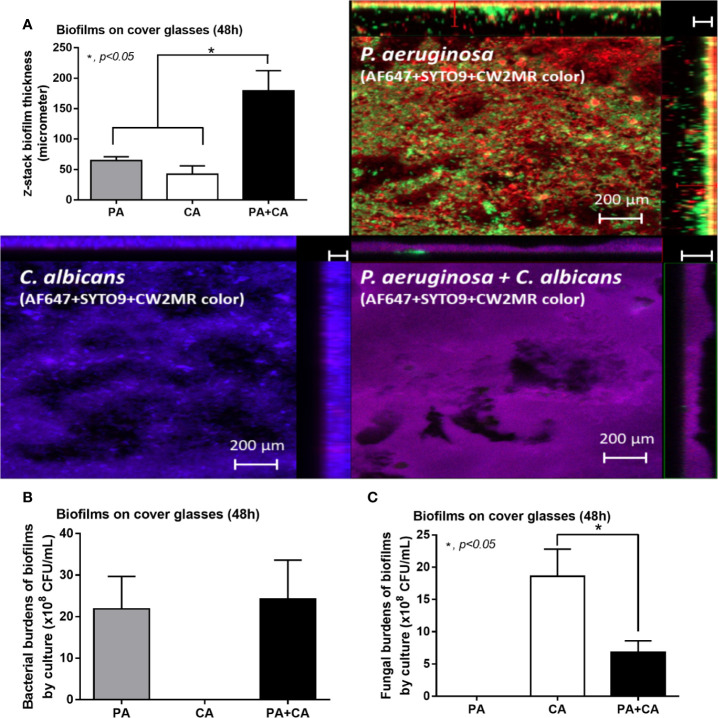
Figure 3.
Biofilm thickness from 48 h biofilm on cover glasses of P. aeruginosa alone, Candida alone, and P. aeruginosa + C. albicans (P. aeruginosa + C. albicans) as evaluated by z-stack analysis of fluorescent images (A) and the burdens of organisms by culture for bacteria (TSA) and for fungi (SDA) (B, C) are demonstrated. Mean ± SE was used for data presentation, and the differences between groups were examined by one-way ANOVA followed by Tukey’s analysis for comparisons of multiple groups or 2 groups, (A–C). A p-value of < 0.05 was considered statistically significant. (Independent triplicate experiments were performed.)

