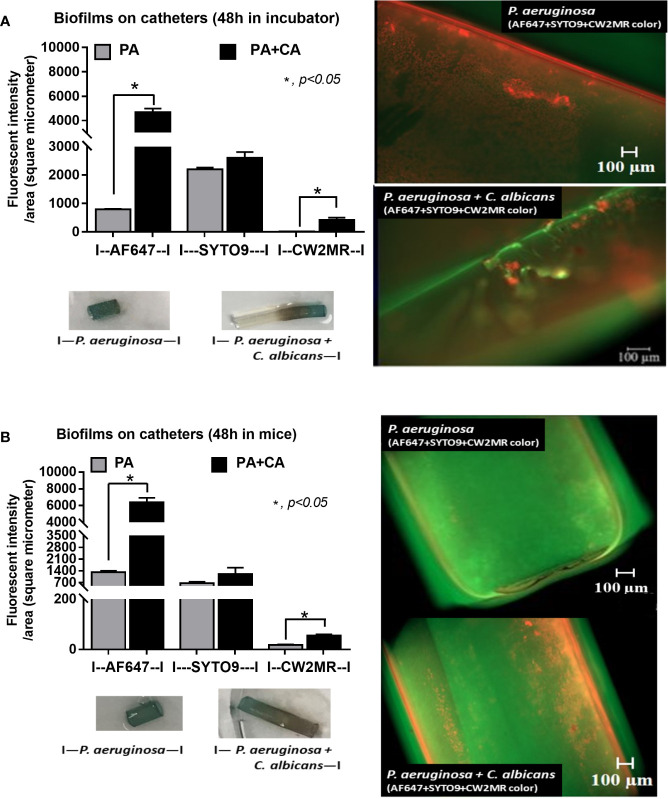
Figure 4.
Diagram of the experimental design demonstrated the lower bacteria during biofilm preparation of P. aeruginosa and C. albicans (P. aeruginosa + C. albicans) compared with P. aeruginosa alone with the score of fluorescent intensity for ECM (AF647), bacterial nucleic acid (SYTO9), and fungal cell wall (CW2MR) together with representative fluorescent images (right side) with eye visualization biofilms (below) of the catheter biofilms after 48 h in an incubator (A) and in mice (B) are demonstrated. Mean ± SE was used for data presentation, and the differences between groups were examined by Student’s t-test for comparisons of multiple groups or 2 groups (A, B). A p-value of < 0.05 was considered statistically significant. (Independent triplicate experiments were performed for A and n = 5/group for B.)

