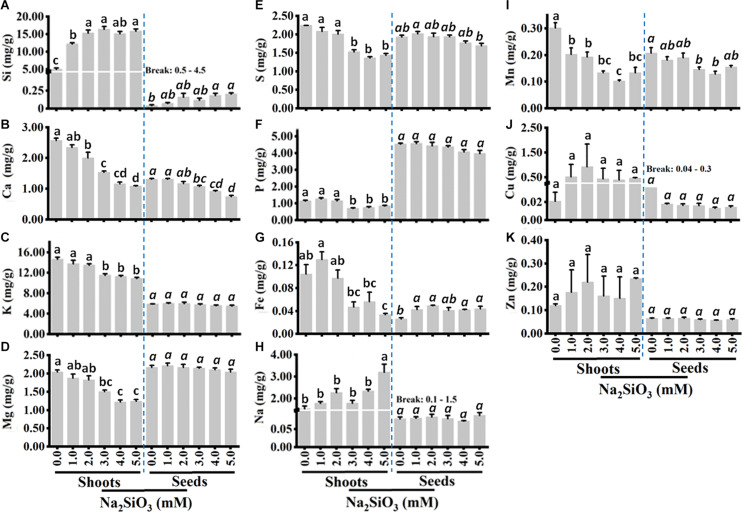
FIGURE 2.
Tef shoot and seed mineral contents of Si (A), Ca (B), K (C), Mg (D), S (E), P (F), Fe (G), Na (H), Mn (I), Cu (J), and Zn (K). Plants were grown without or with varying Si treatments as in panel. Shoot biomass was dried, and mineral content was determined as described in the section “Materials and Methods.” Bars represent means ± SE (n = 4). Bars bearing same letter are not significantly different.

