Figure 3.
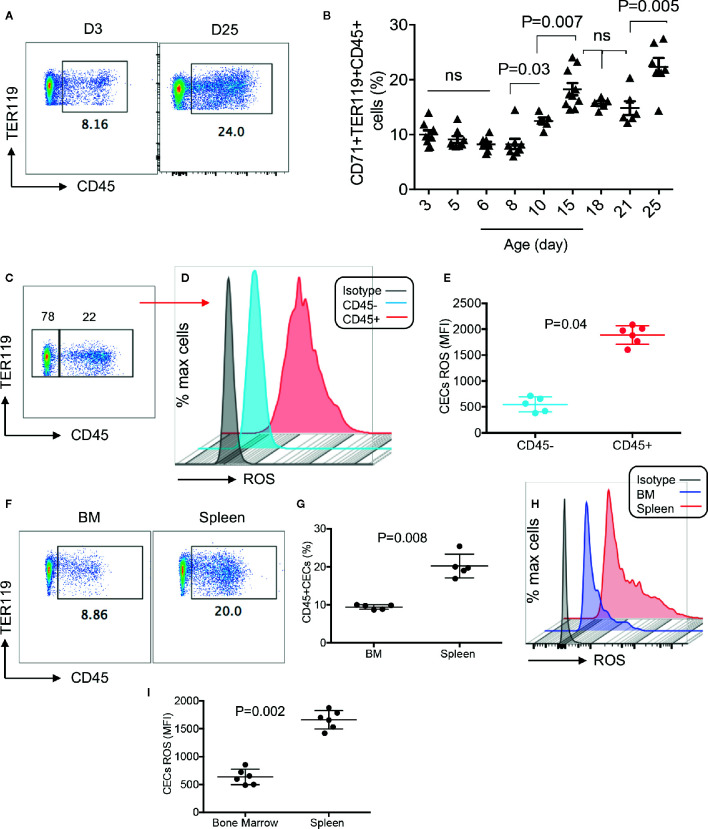
Differential expression of ROS by CD45+ and CD45− CECs in mice. (A) Representative plots showing percentages of CD45+ subpopulation among mice splenic CECs at day-3 and day-25. (B) Cumulative data showing percentages of CD45+ CECs among splenic mice CECs from day 3 to day 25. (C) Representative plot of CD45 expressing CECs in splenic CECs of a 15-day-old mice. (D) Representative histogram of ROS expression in CD45+ versus CD45−CECs from the spleen of a 15-day-old mouse. (E) Cumulative data showing mean fluorescence intensity (MFI) of ROS in CD45+/CD45−CECs of neonatal mice (day 15). (F) Representative plots of CD45 expression among splenic CECs versus their counterparts in the bone marrow (BM) of 15-day-old mice. (G) Cumulative data showing percentages of CD45+ CECs in the spleen versus bone marrow on neonatal mice. (H) Representative histogram of ROS expression in total CECs in the bone marrow compared to the spleen of a day-15 mouse. (I) Cumulative data showing mean fluorescence intensity (MFI) of ROS in the bone marrow versus spleen of neonatal mice.

