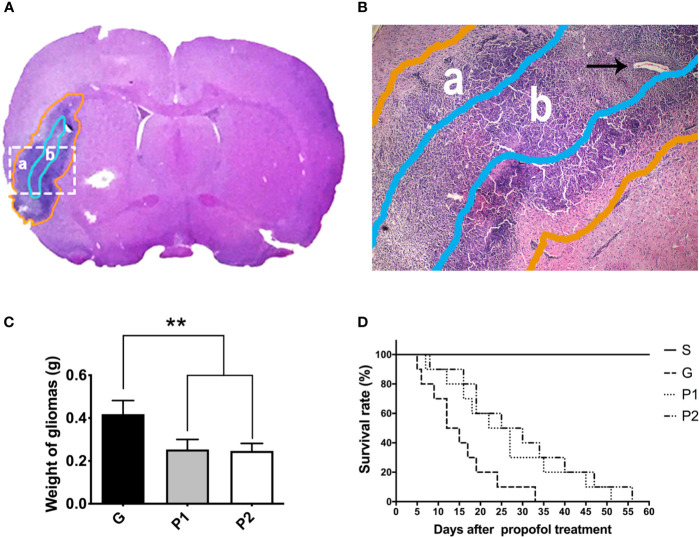
Figure 1.
Shape of rat C6 glioma was revealed by whole-brain slice H&E staining, and 60-day survival curve was analyzed. (A, B) The shape of the glioma (a, gold circle) and tumor core (b, light blue circle) is shown using H&E staining of a tumor tissue coronal slice. Glioma cells and vascular arrangement (arrowhead) observed using optical microscopy (magnification, ×40). (C) On day 18 after establishing the C6 glioma model, the gliomas were removed from the rats and the weight of the fresh tumors was measured. Data are presented as the mean ± standard deviation (n=6/group). (D) The 60-day survival rate was investigated every day after propofol treatment (n=10/group). **P < 0.01. Groups: G, glioma; P1 and P2, propofol 20, and 40 mg/kg-1/h-1, respectively. H&E, hematoxylin and eosin.

