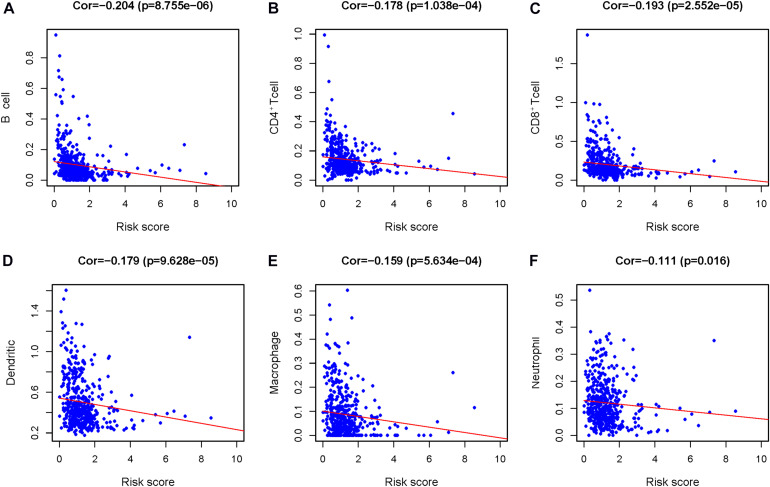
FIGURE 10.
The relationship between the prognosis index of core immune gene and the infiltration amount of six types of immune cells. Correlation analysis was performed using Pearson test. (A) B cells, (B) CD4+ T cells, (C) CD8+ T cells, (D) dendritic cells (DCs), (E) macrophages, and (F) neutrophils.

