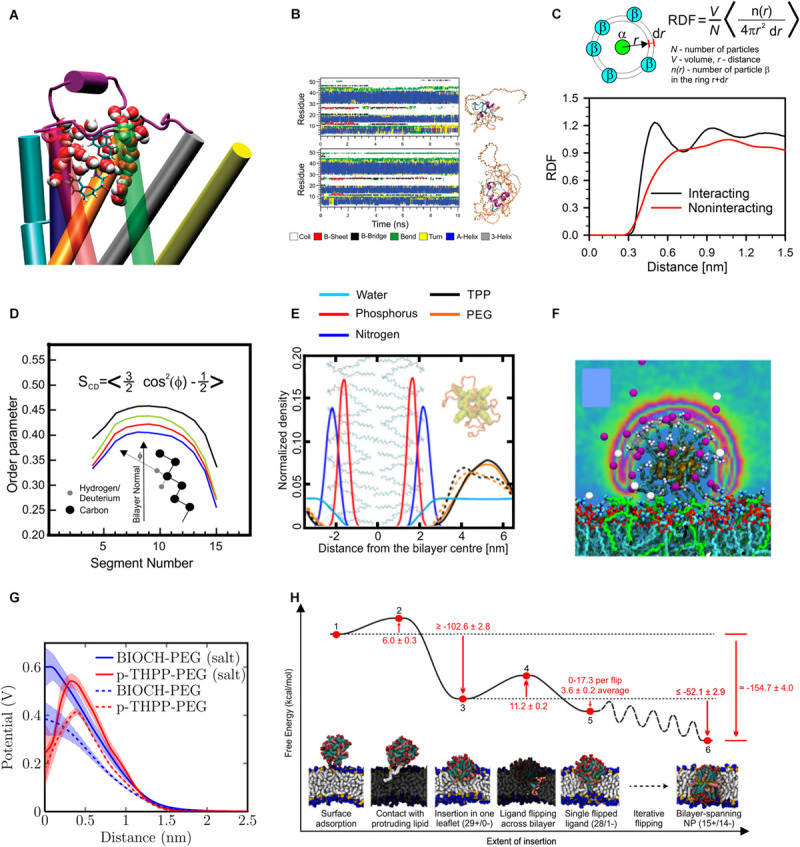
FIGURE 3.

Results of MD simulations. (A) Snapshot showing involvement of water in binding mode of nebivolol to β2-adrenergic receptor, reproduced with permission from Kaszuba et al. (2010), Copyright (2010) American Chemical Society. (B) Time evolution of secondary structure of PEGylated insulin molecules, reproduced with permission from Yang et al. (2011), Copyright (2011) American Chemical Society. (C) An example of radial distribution functions (RDF) for interacting particles (black line) and non-interacting particles, data taken from Roìg and Pasenkiewicz-Gierula (2004). (D) Example of order parameter profile along the lipids acyl chain, reproduced from Mobarak et al. (2018) (CC BY 4.0). (E) An example of density profile showing position of atoms of lipid headgroups (phosphorus and nitrogen) and PEGylated tetra-phenyl-porphyrin (PEG and porphyrin densities are shown separately), at the presence (dashed line) and absence (solid line) of salt in solution, reproduced with permission from Rissanen et al. (2014), Copyright (2014) American Chemical Society. (F) Distribution of counter ions around gold nanoparticle functionalized with hydrocarbons capped with amine group, reproduced with permission from Heikkilä et al. (2014a), Copyright (2014) American Chemical Society, (G) electrostatic potential profile around PEGylated Biochanin (BIOH) and tetra-phenyl-porphyrin (p-THPP) in the presence and absence of salt in solution, reproduced with permission from Rissanen et al. (2014), Copyright (2014) American Chemical Society; (H) free energy landscape for the process of insertion of dendrimer into lipid bilayer, reproduced from Van Lehn and Alexander-Katz (2019), Copyright: 2019 Van Lehn, Alexander-Katz.
