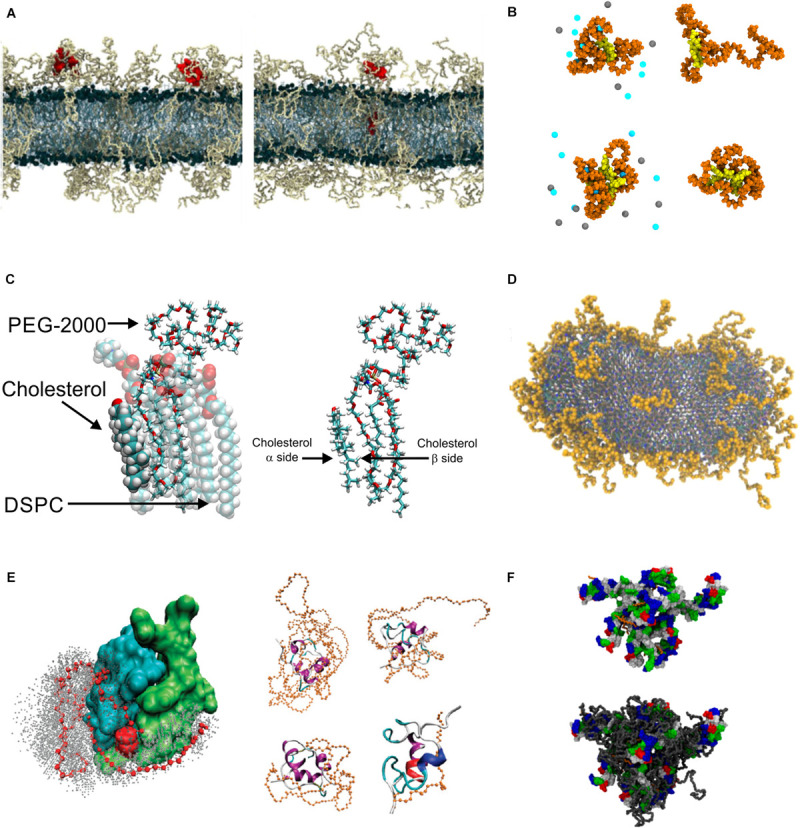
FIGURE 6.

PEGylation. (A) Snapshot showing PEGylated lipid bilayer, reproduced with permission from Dzieciuch et al. (2015), Copyright (2015) American Chemical Society; (B) PEGylated biochanin (upper) and tetra-phenyl-porphyrin (lower), with salt (left) and without salt (right), reproduced with permission from Rissanen et al. (2014), Copyright (2014) American Chemical Society; (C) Snapshots showing DSPC, cholesterol and DSPE-PEG molecules, reproduced with permission from Magarkar et al. (2014), Copyright (2014) American Chemical Society; (D) PEGylated bicelle containing 10.5 mol % DSPE-PEG, reproduced from Viitala et al. (2019), Copyright: 2019; (E) PEGylated insulin, left panel shows position of PEG atoms during simulations, right panel shows snapshots of insulin PEGylated with PEG of various length, reproduced with permission from Yang et al. (2011), Copyright (2011) American Chemical Society.
