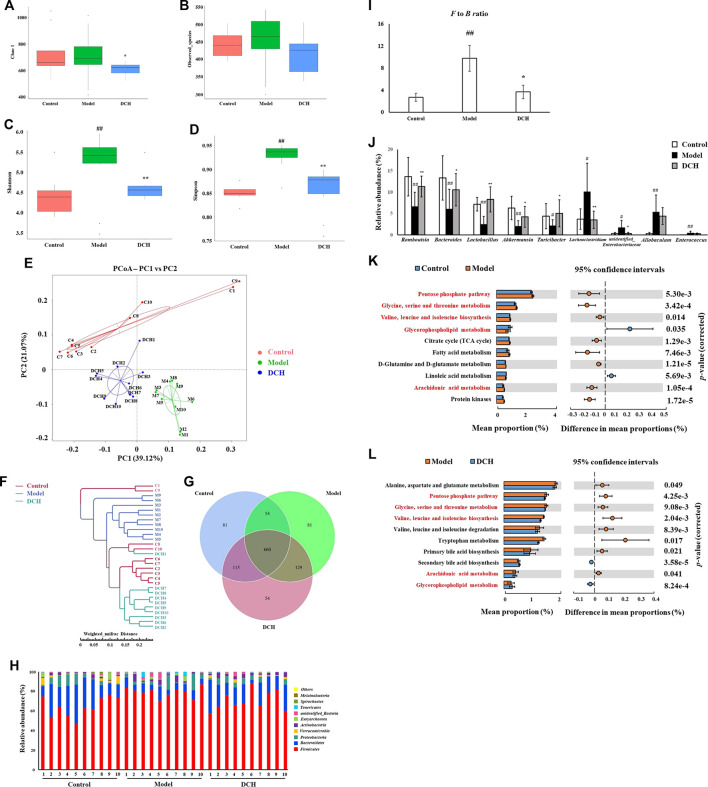
FIGURE 2.
DCH treatment affected the gut microbiota community in NAFLD model rats. (A,B) There were no significant differences in Chao1 index and observed species number in each group. (C,D) Shannon and Simpson indexes were lower in DCH group than that in the model group. (E,F) PCoA and system clustering tree showed more similar beta diversity between DCH and control groups than that between the model and control groups. (G) The different numbers of OTUs were visualized in Venn diagram. (H,I) At the phylum level, DCH treatment decreased the F to B ratio in NAFLD model rats. (J) At the genus level, DCH treatment affected the relative abundances of Romboutsia, Bacteroides, Lactobacillus, Akkermansia, Turicibacter, Lachnoclostridium and unidentified_Enterobacteriaceae in NAFLD model rats. (K,L) The differential metabolic pathways (written in red) of DCH on NAFLD were predicted using PICRUSt analysis based on the 16S rRNA sequencing data. Control, model and DCH (n = 10 per group) groups. Data are presented as the mean ± SD. #: p < 0.05 as compared to the control group; ##: p < 0.01 as compared to the control group; *: p < 0.05 as compared to the model group; **: p < 0.01 as compared to the model group.

