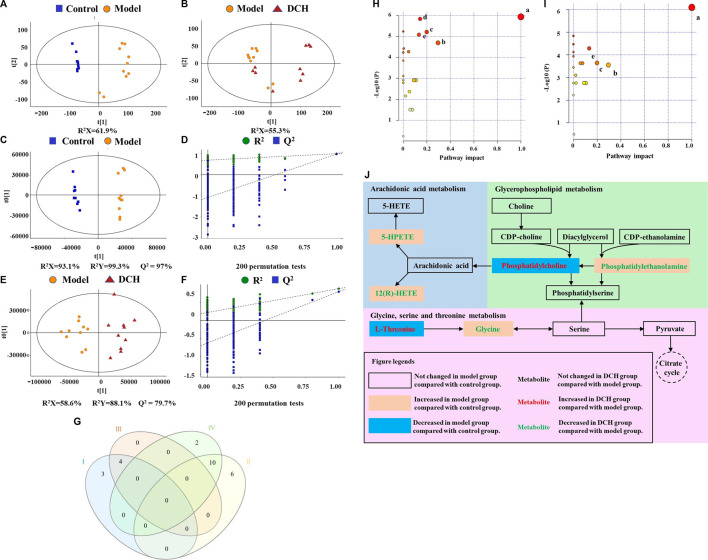
FIGURE 3.
DCH treatment regulated the serum metabolites in NAFLD model rats. (A,B) Scores plots of PCA between the control and model groups and the model and DCH groups. (C,D) Scores plots of OPLS-DA between the control and model groups and the corresponding coefficient of loading plots. (E,F) Scores plots of OPLS-DA between the model and DCH groups and the corresponding coefficient of loading plots. (G) Numbers of differential metabolites between the control and model groups and the model and DCH groups (Venn diagram). Ⅰ: Decreased levels in the model group as compared to the control group; Ⅱ: Elevated levels in the model group as compared to the control group; Ⅲ: Elevated levels in the DCH group as compared to the model group; Ⅳ: Decreased levels in the DCH group as compared to the model group; (H,I) Summary of pathway analysis of serum samples between control and model groups and between model and DCH groups. (A) Linoleic acid metabolism; (B) Glycine, serine and threonine metabolism; (C) Glycerophospholipid metabolism; (D) Tryptophan metabolism; (E) AA metabolism. (J) Schematic of AA, glycerophospholipid, and glycine/serine/threonine metabolism pathways in NAFLD rats after DCH treatment. Control, model and DCH (n = 10 per group) groups.

