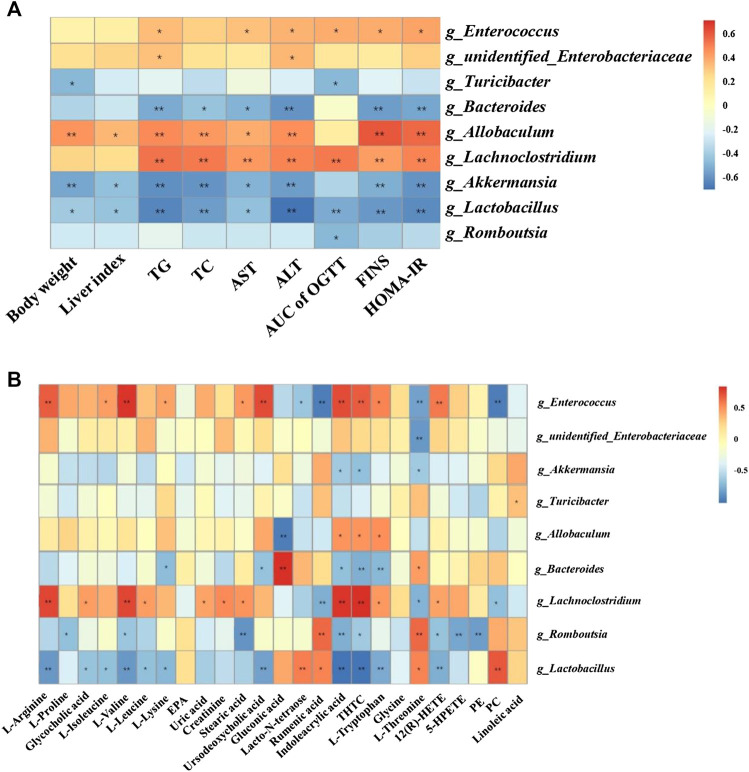
FIGURE 4.
Correlation analysis of pathological indices, untargeted metabolomics and 16S rRNA sequencing. Correlations between physiological indices and gut microbiota (A) and between untargeted metabolomics and gut microbiota (B) were analyzed using spearman’s analysis (heatmap). X-axis represents the physiological indices (A) and differential metabolites in the serum (B). Y-axis represents the gut microbiota with differential abundance. The colors of grids represent the correlation analysis value of spearman’s correlation analysis. Grids in red indicate positive correlations (correlation analysis value more than 0.1), while grids in blue indicate negative correlations (correlation analysis value less than −0.1). Color coding scale indicates the correlation analysis value from heatmap, the deeper red or blue indicates higher correlation values. *: p < 0.05 between physiological indices and differential gut microbiota (A), or between differential serum metabolites and gut microbiota (B). **: p < 0.01 between physiological indices and differential gut microbiota (A), or between differential serum metabolites and gut microbiota (B).

