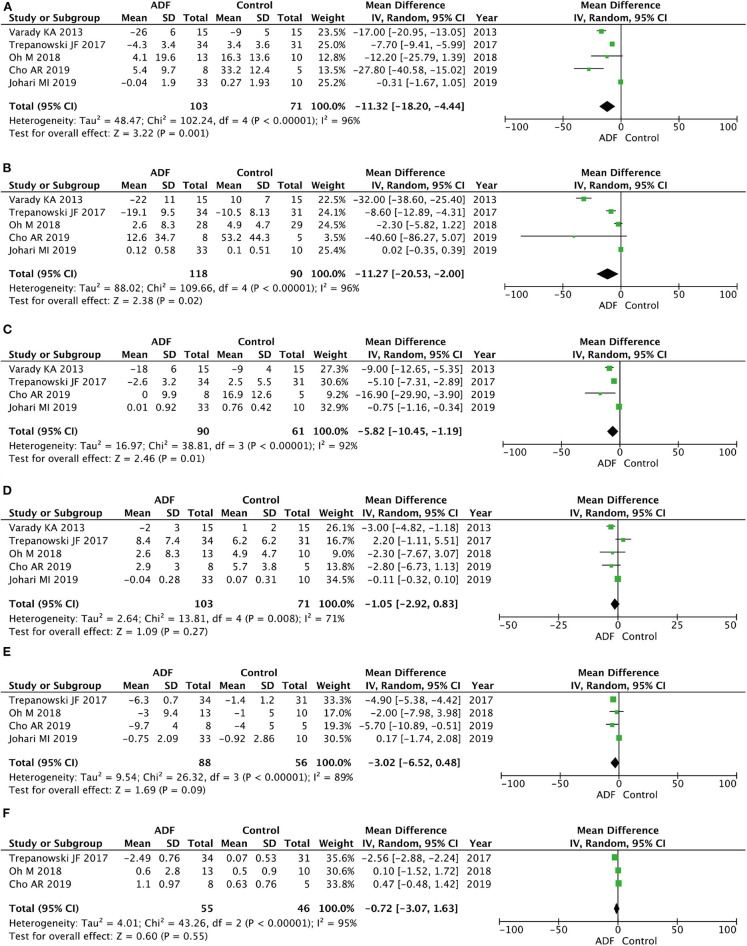
Figure 5.
Forest plots showing changes between two groups in (A) total cholesterol (TC), (B) triglycerides (TG), (C) low-density lipoprotein (LDL), (D) high-density lipoprotein (HDL), (E) fasting blood sugar (FBS), (F) homeostasis model assessment-insulin resistance (HOMA-IR); SD, standard deviation; IV, inverse variance; CI, confidence interval; df, degrees of freedom.

