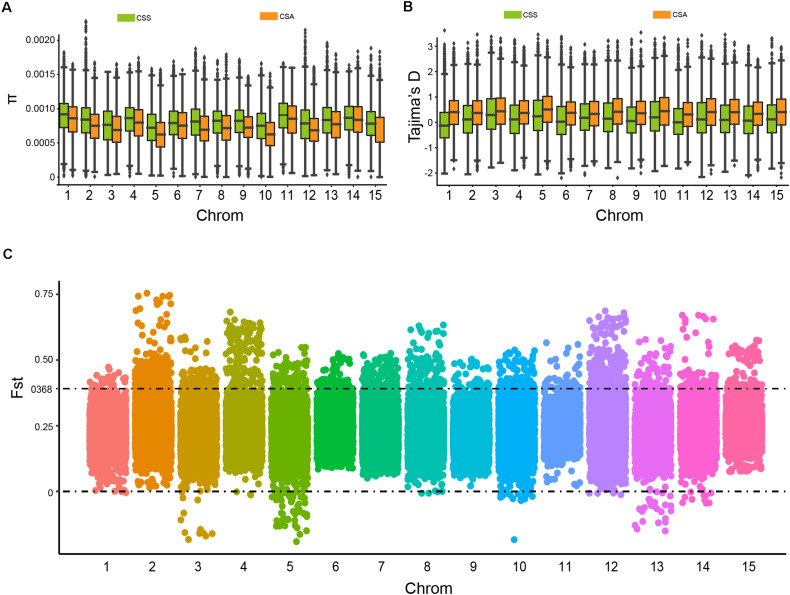
FIGURE 3.
The nucleic acid diversity (π), Tajima’s D value of CSS and CSA subgroups, and candidate differentiation regions identified in CSS and CSA subgroups on the genome. (A) Nucleic acid diversity. (B) Tajima’s D value. (C) Distribution of windowed Fst values for CSA versus CSS (window size 500 kb and step 50 kb), the dots above the dotted line represent candidate differentiation windows on the chromosome.

