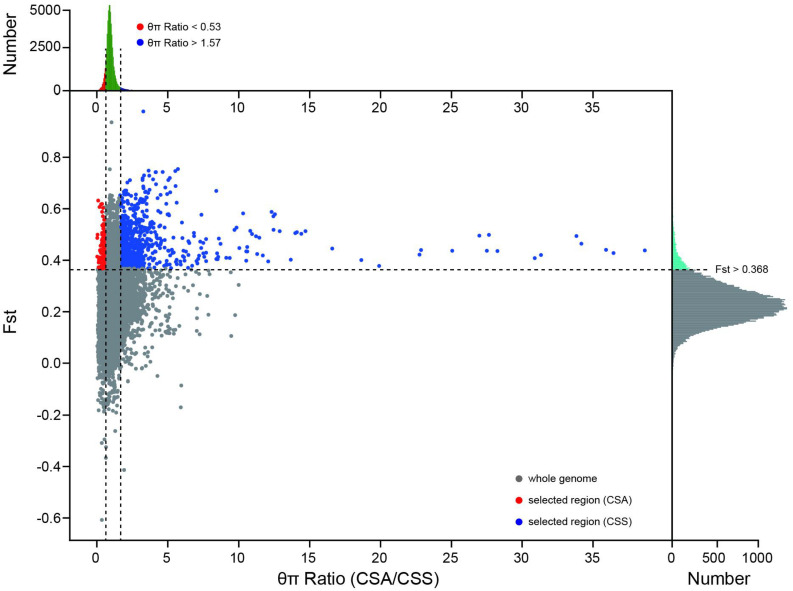
FIGURE 5.
Fst and θπ based selective sweep identification between CSS and CSA population. The red dots and blue dots indicate the selected regions of the CSA and CSS subgroups on the genome, respectively. The subplot on the top reflects the distribution of θπ Ratio, and the subplot on the right reflects the distribution of Fst.

