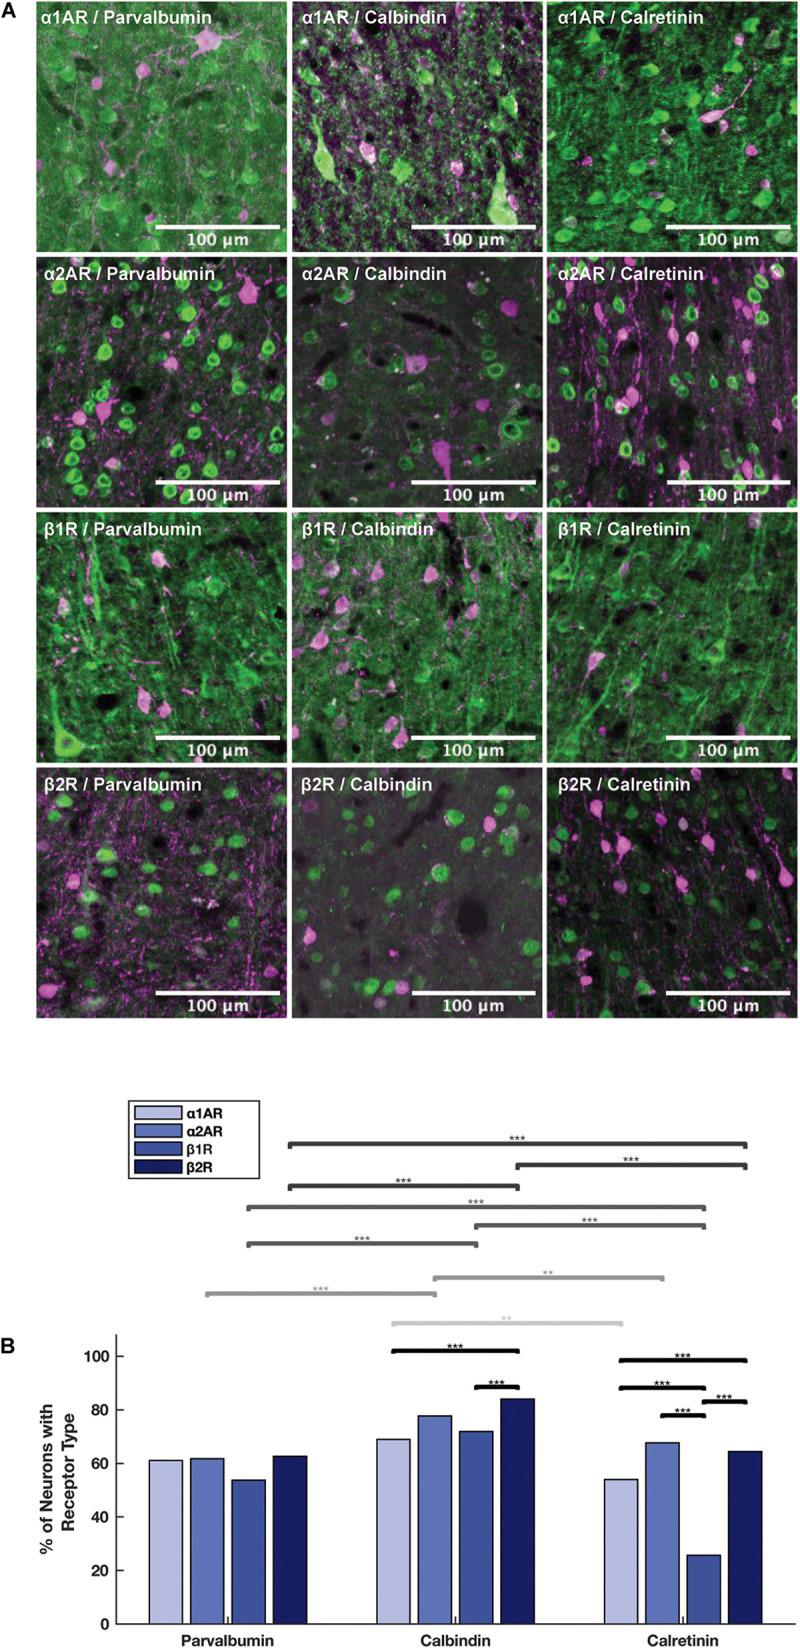
FIGURE 6.

Expression of adrenergic receptors on inhibitory interneurons. (A) Panels show expression of α1A, α2A, β1, and β2 adrenergic receptors (α1AR, α2AR, β1R, and β2R, respectively) from top to bottom with inhibitory interneuron markers (parvalbumin, calbindin and calretinin) from left to right. All adrenergic receptors are labeled in green, and all inhibitory interneurons are labeled in magenta. (B) Quantification of the proportion of each neuron class that expressed each receptor class. Chi-squared tests were performed using pooled neuron counts across all animals. Lines above the bars show the significance of different comparisons. Black lines indicate significant differences between the expression of different receptors within a neuron class; gray lines indicate significant differences of expression of a specific receptor across different neuron classes. The shade of gray indicates which receptor class is being compared and matches the shading of the bars: from light to dark—α1AR, α2AR, β1R, and β2R. Significance levels are noted as ***p < 0.001; **p < 0.01; and *p < 0.05. Scale bar = 100 μm for all panels.
