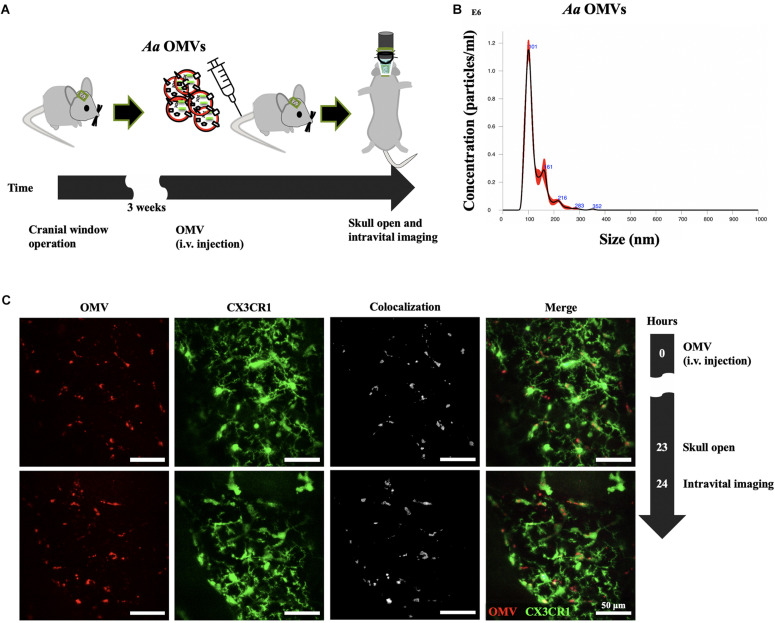
FIGURE 1.
Delivery of Aa OMVs into microglial cells. (A) Schematic diagram of intravital imaging process performed in this study. (B) Nanoparticle tracking analysis (NTA) of Aa OMVs used in this study. OMVs from Aa were analyzed using the NanoSight system to visualize the size distribution (X-axis) and particle numbers (Y-axis). (C) Intravital image was captured 24 h after Aa OMV i.v. injection. OMVs were colocalized with GFP-positive microglial cells. Scale bar: 50 μm. Additional Figures can be found in Supplementary Figure S3.

