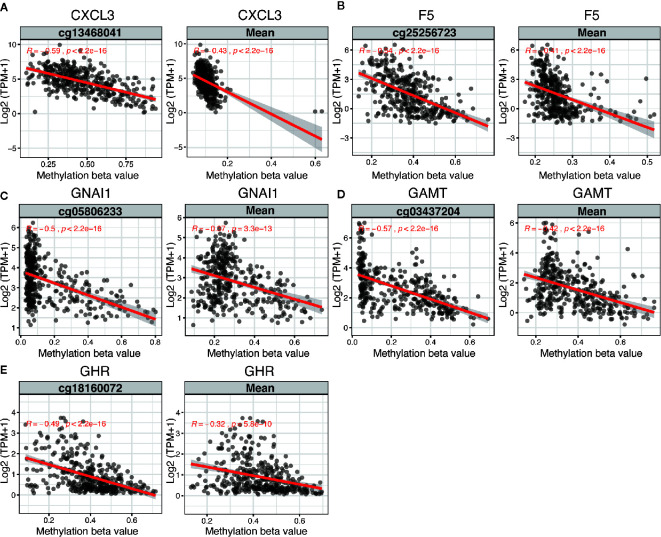
Figure 2.
Regression analysis between gene expression and DNA methylation of five candidate predictors in TCGA dataset. Regression analysis between gene expression and DNA methylation (including methylation of CpGs in the promoter and mean methylation) of CXCL3 (A), F5 (B), GNAI1 (C), GAMT (D) and GHR (E). The horizontal and vertical axis represents methylation and mRNA expression of the DNA methylation-driven gene, respectively. TPM, transcripts per million.

