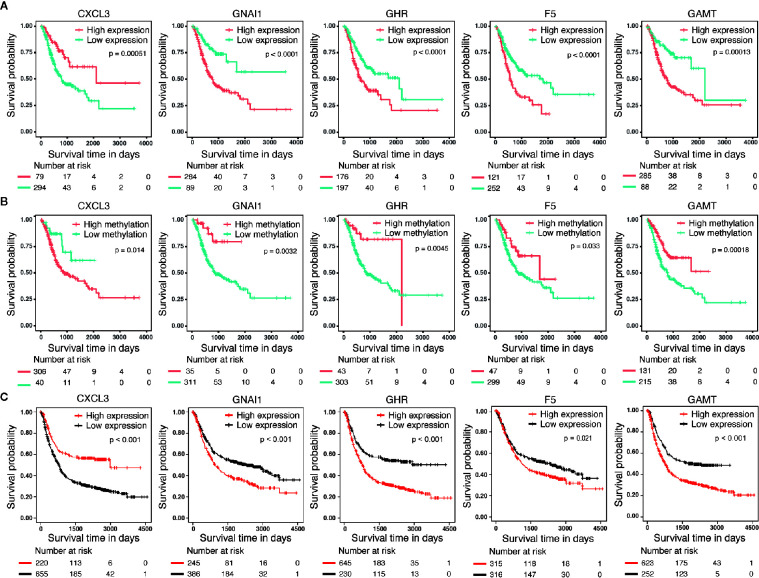
Figure 3.
Survival analysis for five candidate predictors. (A) Survival analysis based on gene expression level for CXCL3, F5, GNAI1, GAMT and GHR in 373 patients with GC. (B) Survival analysis based on DNA methylation level for CXCL3, F5, GNAI1, GAMT and GHR in 346 patients with GC. The horizontal axis and vertical axis denote the survival time and the survival probability, respectively. (C) Survival analysis based on gene expression level for CXCL3, F5, GNAI1, GAMT and GHR in GSE14210, GSE15459, GSE22377, GSE29272, GSE51105 and GSE62254 microarray dataset.

