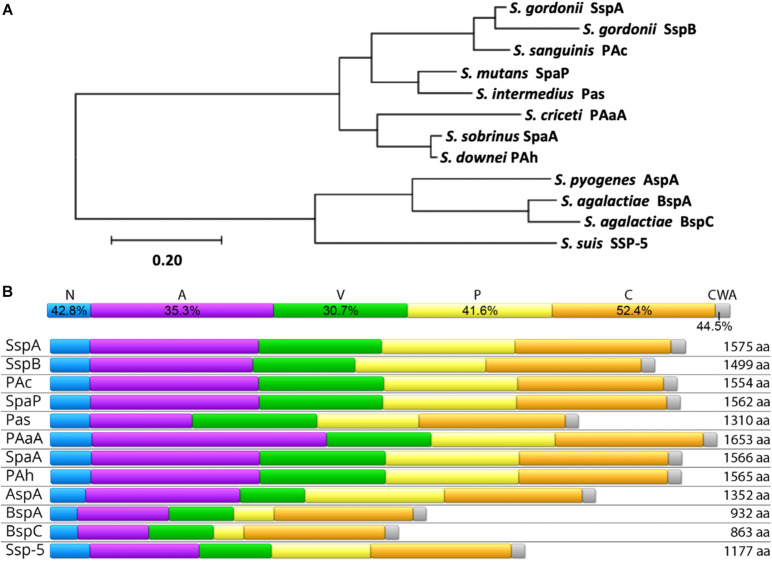
FIGURE 1.
Homology of AgI/II Family Proteins. (A) The evolutionary history was inferred by using the Maximum Likelihood method and JTT matrix-based model (Jones et al., 1992) using full-length amino acid sequences of the indicated proteins. The tree with the highest log likelihood (–21701.96) is shown. The tree is drawn to scale, with branch lengths measured in the number of substitutions per site. Evolutionary analyses were conducted in MEGA X (Kumar et al., 2018). (B) Conservation of individual domains is shown (top) as the pairwise identity percentage resulting from a MUSCLE protein alignment of each individual domain, as well as the primary structure and amino acid length of AgI/II proteins from select streptococci (bottom). The domains shown are the N-terminal region (N; blue), alanine-rich repeats (A; purple), the variable region (V; green), proline-rich repeats (P; yellow), the C-terminal region (C; orange), and the cell wall anchoring region (CWA; gray). The Uniprot IDs for protein sequences used in both (A,B) are as follows: S. mutans SpaP (P23504), S. gordonii SspA (Q54185), S. gordonii SspB (Q54186), S. agalactiae BspA (Q8E589), S. agalactiae BspC (A0A380IJX7), S. pyogenes AspA (Q48S75), S. intermedius Pas (Q9KW51), S. sobrinus SpaA (Q53414), S. sanguinis PAc (F3V086), S. criceti PAaA (Q9LBG3), S. downei PAh (Q59HN9), and S. suis SSP-5 (A0A0Z8CV71).

