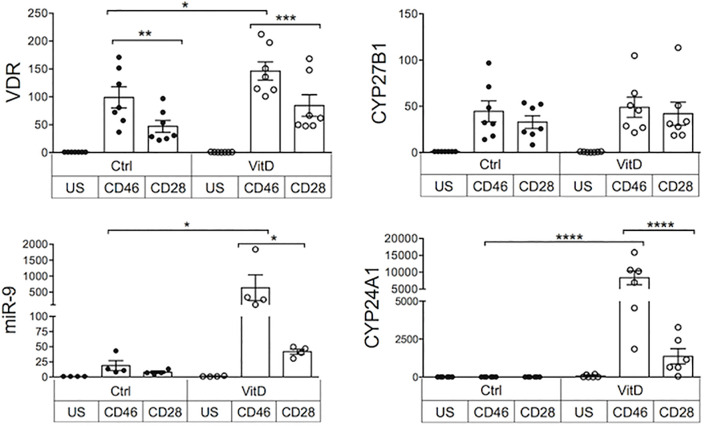
Figure 5.
Crosstalk between the CD46 and vitamin D pathways. Human CD4+ T cells were activated as indicated and expression of VDR, miR-9, CYP27B1, and CYP24A1 was quantified by qPCR after 4 days. Relative quantification was calculated according to the expression of the house keeping gene (ΔCt) and the fold change compared to unstimulated samples (2-ΔΔCt) was calculated. Analysis was performed using one way Anova with Sidak’s multiple comparisons test. *: p<0.05 to 0.01, **: 0.001 to 0.01, ***: 0.0001 to 0.001, and ****: < 0.0001.

