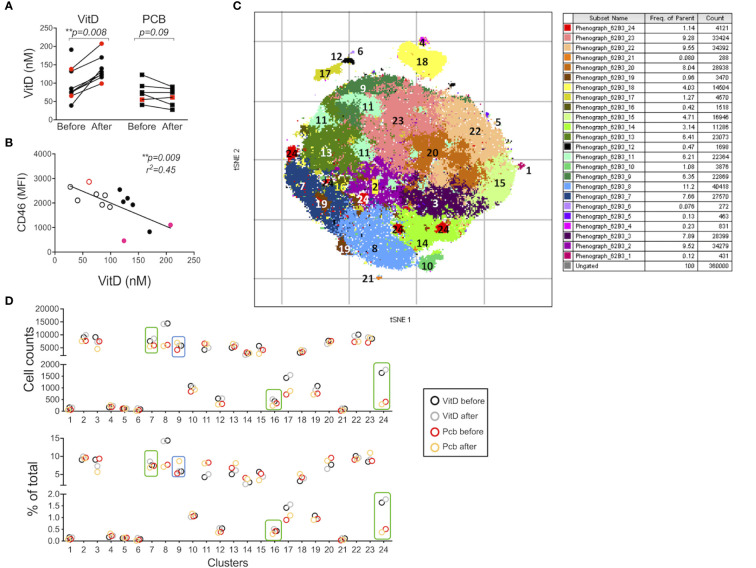
Figure 6.
Vitamin D supplementation modulates the phenotype of T cells in patients with multiple sclerosis (MS) in vivo. (A) 25(OH)D levels in serum before and after a 16-week treatment with vitamin D or placebo (PCB) in a cohort of patients with MS (11 IFNβ-treated, 3 untreated, red dots). (B) Correlation between the expression of CD46 on circulating CD3+CD4+ T cells and vitamin D concentration. Placebo: open circles, vitamin D: closed symbols, untreated patients depicted as red dots. (C) t-SNE was run on the concatenate file of 360,000 cells (perplexity = 100, iteration = 1000, Eta= 44,099). Phenograph was also run to identify clusters (K=50) in the CD3+CD4+ T cells from five patients supplemented with vitamin D and four placebo (all IFNβ treated). (D) Cell counts and percentage of the 24 clusters identified by PhenoGraph (in C) in the vitamin D and placebo groups before and after treatment. Boxes identified the clusters for which a differential modulation was observed with vitamin D and placebo.

