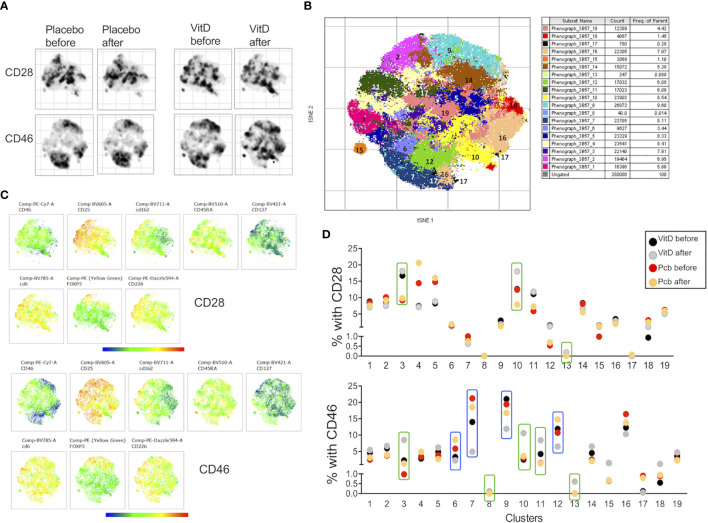
Figure 8.
Vitamin D supplementation modulates the phenotype of T cells in patients with multiple sclerosis (MS) after in vitro activation. (A) t-SNE representation and (B) intensity of staining of CD46, CD25, CD162, CD45RA, CD127, CD6, Foxp3, and CD226 in CD3+CD4+ T cell clusters after CD28 or CD46 costimulation of PMBCs from patients with MS supplemented by vitamin D or placebo (n=3 and n=4, respectively). (C) visualization of clusters identified by Phenograph on t-SNE-map analysis of the CD3+CD4+ T cells. (D) Percentage of the 19 clusters identified by PhenoGraph in the vitamin D and placebo groups before and after treatment. Clusters increased (green boxes) or decreased (blue boxes) after vitamin D supplementation are indicated.

