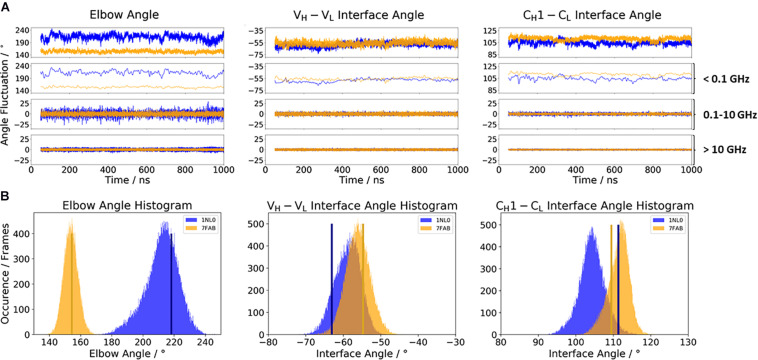
FIGURE 2.
(A) Comparison of the two considered λ light-chain antibodies 10C12 (PDB: 1NL0) and IgG1 Fab (PDB: 7FAB). The biggest difference between these two antibodies is the elbow angle. The distributions of the 10C12 antibody are depicted in blue, while the IgG1 antibody angle distributions are colored yellow. Additionally, the FFT of the respective distributions are displayed, showing the angle variations occurring faster than 1 ns, between 0.1 and 10 ns, and slower than 10 ns. (B) Histograms of the respective interface and elbow angle distributions, including the respective X-ray structures of both λ light chain antibodies, which were used as starting structures for molecular dynamics simulations.

