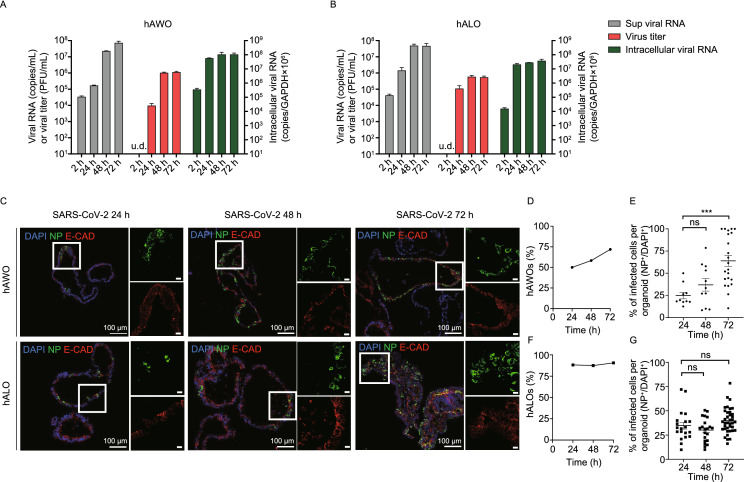
Figure 2.
SARS-CoV-2 replicates in human airway and alveolar organoids. (A and B) The viral RNA and virus titer in the culture supernatant and relative intracellular viral RNA in cell lysates in hAWOs (A) and hALOs (B) were detected at indicated time points post infection. (C) Immunofluorescence images of viral nucleoprotein (green) and epithelial marker E-cadherin (red) expression with DNA stain (DAPI, blue) in SARS-CoV-2 infected hAWOs and hALOs. Scale bar, 100 μm (left panel); 20 μm (right panel). Boxes represent zoom views. (D and F) Percentage of hAWOs (D) and hALOs (F) harboring SARS-CoV2 infected cells at different time points. At least 30 different organoids were counted per condition. (E and G) Percentage of infected cells per infected hAWOs (E) and hALOs (G). At least 10 organoids were counted in (E) and at least 20 organoids in (G). ***P < 0.001, by one-way ANOVA analysis

