Figure 5.
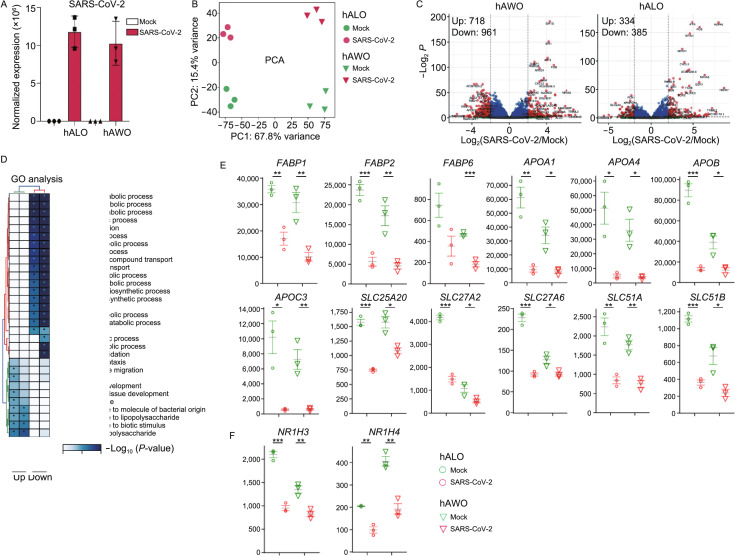
SARS-CoV-2 infection downregulates metabolic processes in human lung organoids. (A) SARS-CoV-2 viral RNA detected by RNA-seq in mock and infected organoids harvested at 48 hpi. Data are expressed as normalized read counts. (B) PCA plot for the Mock and SARS-CoV-2 infected organoids. (C) Volcano plot showing differentially expressed genes in the SARS-CoV-2 infected organoids compared with mock control. (D) Gene ontology (GO) analysis showing the differentially expressed genes from panel (C). (E) Expression level of lipid metabolism related genes, the grey lines are the means of the three biological replicates, and the error bars are the standard error of the mean. Data are expressed as normalized read counts. P-values are from a one-tailed Student’s t test. *P < 0.05, **P < 0.01, ***P < 0.001, ****P < 0.0001. (F) Expression level of LXRα (also known as NR1H3) and FXR (also known as NR1H4), two critical nuclear receptors regulating sterol, fatty acid and glucose metabolism

