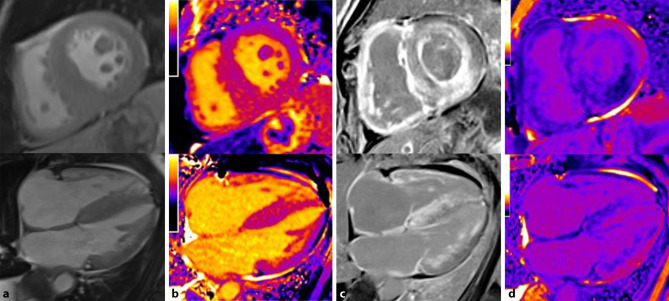
Fig. 3.
Magnetic resonance tomography in a patient with cardiac transthyretin amyloidosis. Top row: short axis view. Bottom row: four-chamber view. a Functional cine imaging showing pronounced left ventricular hypertrophy. b T1 mapping showing globally increased T1 relaxation times of 1180 ± 38 ms. c Biventricular late gadolinium enhancement with subendocardial enhancement showing characteristic, global patchiness mostly in the basal segments of the myocardium. d Extracellular volume (ECV): globally increased ECV of 58.4%, estimated according to the formula: ECV = (1 − hematocrit) × [1/post-contrast T1 myocardium − 1/native T1 myocardium]/[1/post-contrast T1 blood − 1/native T1 blood]

