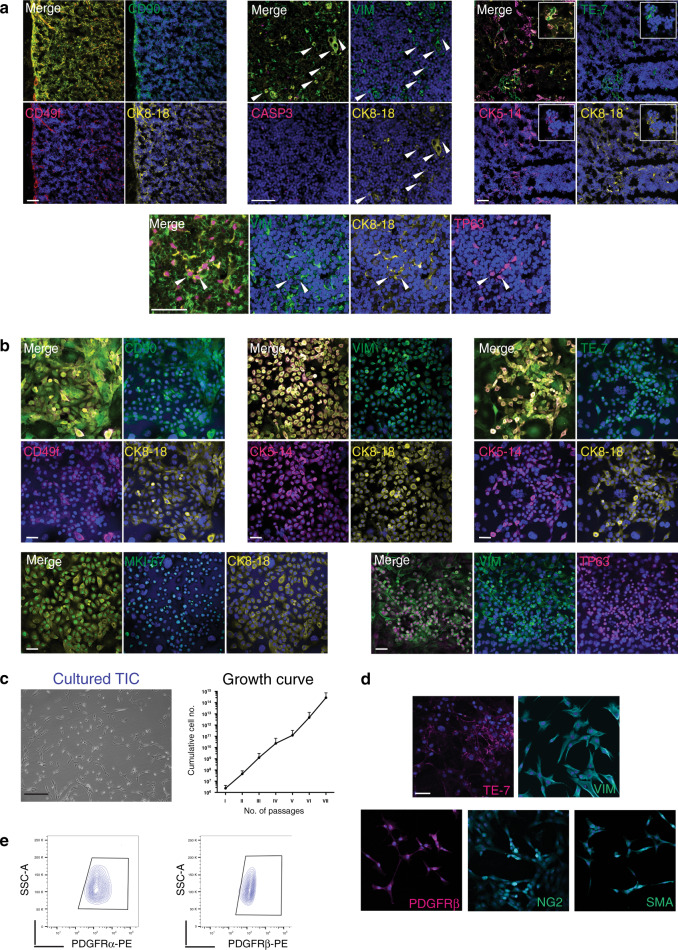
Fig. 3. Phenotypic analysis of in vitro expanding thymic stromal cells.
a Immunofluorescence labelling of thymic epithelial cells in human post-natal thymus where CK8-18 antibody (yellow), CK5-14 or CD49f (magenta) marked TEC. Tissues contains healthy cells as shown by absence of CASP3 (top mid panel). Co-staining with CD90 (top left panel), vimentin (VIM, top mid panel) or TE7 (top right panel) in green shows epithelial cells with mesenchymal features. Bottom panel shows co-expression of VIM (green), CK8-18 (yellow) and transcription factor TP63 (magenta). Arrow and inserts (white) highlight individual cells with hybrid phenotype. Nuclei are stained with DAPI. Scale bar, 50 μm (n = 4 thymi). b Immunofluorescence labelling of epithelial and mesenchymal markers on expanding thymic epithelial cells colonies expressing CD90 (left panels), VIM (middle panels) and TE7 (right panels) in green. Most of TEC in culture co-express cytokeratin CK5-14 (magenta) and CK8-18 (yellow), CD49f (magenta) together with mesenchymal markers. Bottom panels: left, TEC express proliferation marker MKI67 (green) and right panels: TEC co-express transcription factor TP63 (magenta) with VIM (green). Nuclei are stained with DAPI (n = 4 independent cultures). Scale bar, 50 μm. c Left panel: phase contrast image of thymic interstitial cells (TIC) expanded after sorting. Scale bar, 200 μm. Right panel: growth curve shows TIC expansion over several weekly passages (n = 4 independent cultures, data are presented as mean value ± S.D.). d Immunofluorescence of cultivated TIC demonstrates protein expression for TE7 and vimentin (VIM), as well as PDGFRβ, NG2 and Smooth Muscle Actin (αSMA), n = 3 independent cultures. Scale bar, 40 μm. e, Representative FACS analysis of expanded TIC for mesoderm markers PDGFRα (PE), PDGFRβ (PE), n = 5 independent cultures.

